Original Author: Dr Hafsa Waseela Abbas
Original published date: 4th March 2015
Updated by: Dr Hafsa Waseela Abbas
Update date: June 2025
Next Review date: June 2026

A molecular and genetic understanding of cancer origins has generated significant progress in stratified medicine. The primary objective of stratified medicine is to identify the different mechanisms of disease and the patient’s response to a given drug or a combination of drugs (Singh, 2016). This helps to develop therapies and diagnostic tools that provide better health stances. The differentiation of the patient population into defined subsets is the initial step before evaluating the safety and effectiveness of drugs for an aimed sub-group of patients with analogous biological characteristics. This can pinpoint areas of improvement and direct translational research. This is beneficial on multiple levels: medically, economically, and socially within the frameworks of the healthcare system.
The establishment of Cancer Research UK’s Stratified Medicine Programme (SMP) has had a significant impact on research progress. It entails molecular profiles with detailed information for more than 9000 tumours. The program instigated collaborations with the National Health Service and pharmaceutical companies predominantly Pfizer and AstraZeneca to develop a national service model that can routinely examine tumours with specific genetic variations and deliver personalized cancer care (Cerone et al., 2023). This empowers clinicians with guidance on decision-making due to the high accuracy in assessing patients and their treatment planning. It will also increase the researcher’s understanding of how these genetic drivers can influence the diagnosis, prognosis, and efficacy of treatments by designing clinical trials based on appropriate patient stratification. This helps minimize the severity of the disease, less prone to side effects of treatment and medical error. Such vital information in the program can assist presymptomatic individuals by delaying the onset of the disease or preventing its existence (Singh, 2016). In this modest article, the aim is to provide insight into the recent advances in the main research methods on how stratified medicine altered cancer: biomarkers, microarrays, immunohistochemistry, metabolomics, proteomics, and polymerase Chain Reaction (PCR).
Biomarkers and its role in stratified medicine
What are biomarkers and how are they classified?
Biomarkers are one of the prominent ways in which stratified medicine is altering cancer treatment. They are defined as biological characteristics (genetic, biochemical, and cellular) that may indicate pathogenic processes, normal biological state or identify subgroups that can pharmacologically respond negatively or positively to therapy. They are broadly categorized into prognostic and predictive biomarkers to establish clinical relevance and make effective decisions by classifying patients into distinct subsets and conditions (Friedlin, McShane, and Korn, 2010).
Prognostic biomarkers organize patients treated with standard therapies and control (no treatment) into subgroups where they vary based on expected clinical outcomes. For instance, a prognostic marker can identify if a patient is at low or high risk of recurrence if, in the latter group, patients will be treated solely (Friedlin, McShane, and Korn, 2010).
Predictive biomarkers can either be sensitive or resistant to the drug. For instance, patients with advanced colorectal tumours that have wild-type KRAS genotypes are sensitive to Cetuximab and Panitumumab (Karapetis et al., 2004; Shen et al., 2020). Biomarkers that predict toxicity are evaluated separately as another form. This contours the dual effect of biomarkers anticipated in both clinical practice and diagnostic methods (Trusheim, Berndt, and Douglas, 2007).
Bowel cancer and stratified medicine
Other mutational analyses in bowel cancer besides KRAS were studied like a gastrointestinal stromal tumour (GIST). They are the most common mesenchymal tumours that clinically vary from benign to large cancers (Shen et al., 2020). GIST accounts for 1 – 4% of malignant gastric tumours (Corless, Barnett, and Heinrich, 2011). PDGFRA mutations were mainly associated with gastric location (89.8%) and have benign clinical behaviour (Lasota et al., 2004). GIST with KIT exon mutations are commonly duplications in exon 9 and deletions in exon 11 are associated with malignant potential and shorter disease-free survival (DFS) post-surgery (Martin et al., 2005). Patients with exon 11 mutant GISTs are sensitive to imatinib therapy and have significantly improved prognoses after three years post-surgery, particularly those present with one codon (Joensuu et al, 2017).
Mutational analysis is also a predictive measure of recurrence-free survival. Patients with mutations in exon 11 of the KIT genes, had more recurrence-free survival compared to patients with exon 9. Patients with wild-type GIST generally had disease but narrow sensitivity to Imatinib in most cases. Thus, risk stratification and mutational analysis are necessary for optimizing therapeutic approaches (Shen et al., 2020).
Non-small cell lung cancer (NSCLC) as an experimental model for stratified medicine
One of the main cancers that have been profoundly evaluated in stratified medicine and have transformed outcomes in targeted therapy is non-small cell lung cancer (NSCLC) – please see Figure 1. This form of lung cancer is highly prevalent where it accounts for 80 to 85% of cancer cases (Cancer Research UK, 2022). There are four stages in NSCLC pathogenesis where the spread of cancer and the size of the tumour escalates with stage. This may explain the reason for designated treatment options per stage (Brar, 2025).
There are certain patterns of disease displayed in NSCLC that correspond to the histological subtypes. Squamous cell carcinoma otherwise known as epidermoid carcinoma. It arises in the thin, flat cells that align the inside of the lungs. This typically occurs in proximal segmental bronchi that can grow slowly. Adenocarcinoma ascends from the lining of the sac-like structures called alveoli where gaseous exchange takes place. It also secretes mucus. It accounts for 50% of cases and initially manifests with fatigue, shortness of breath (dyspnoea), and pain in the chest. The severity of the chronic cough and bloody sputum because of coughing up blood (haemoptysis) soars in the later stages (Brar, 2025). Large cell carcinoma initiates in several types of large cells that reside in the lung tissue (National Cancer Institute, 2025). There is ca. 70% of NSCLC patients with durable effects and limited treatment. Overexpression of oncogenes, epidermal growth factor receptor (EGFR), deactivation of tumour suppressor genes p53, telomerase activation, and point mutation of Ras can stimulate proliferation and signal transduction pathways are amongst the genetic aberrations in lung cancer (Friedlin, McShane, and Korn, 2010). Therefore, the development of target therapy is essential and poses a major challenge as 50% of the underlying genes remain unknown (Fawdar et al., 2013).
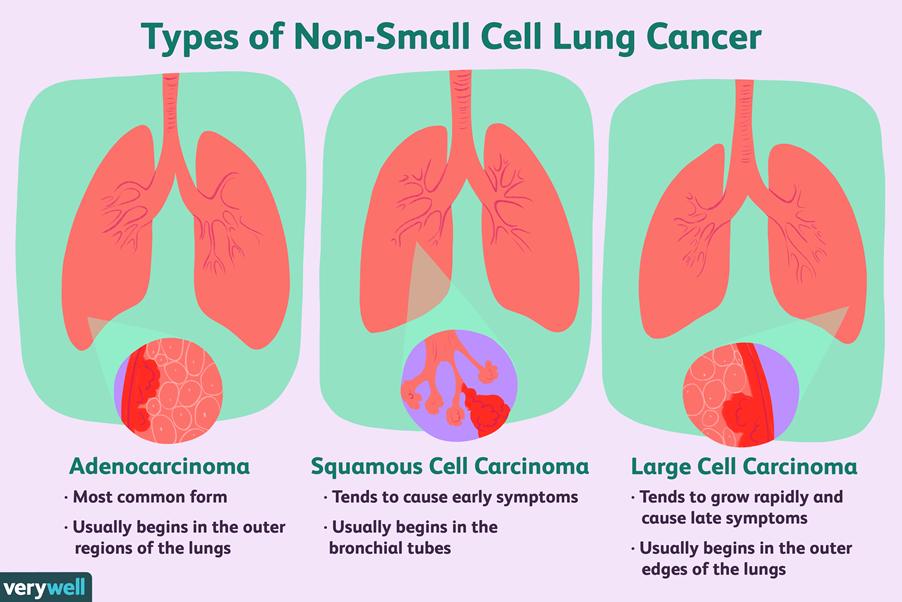
Figure 1: Types of lung cancer tissue
Biomarker-stratified medicine
Another way in which biomarkers are classified is by the type of randomized control trial (RCT) illustrated in Figure 2. It helps to provide a comprehensive assessment of the relationship between the biomarker and therapeutic effect (Friedlin, McShane, and Korn, 2010). Other contributing factors, feasibility, providing reliable evidence, and time efficiency are also paramount. The first type of RCT design is Biomarker-stratified medicine – please see Figure 2A. They are utilized when there is a minimum of two or more therapeutic options without evidence of one being preferred in each population (Friedlin, McShane, and Korn, 2010). Patients are assigned randomly despite their biomarker status. An analysis plan is then stratified via biomarkers (positive and negative) to examine the treatment effect. Non-stratified randomization may also be performed when feasible. This highlights the unbiased scientific method used to assess each biomarker-defined subgroup.
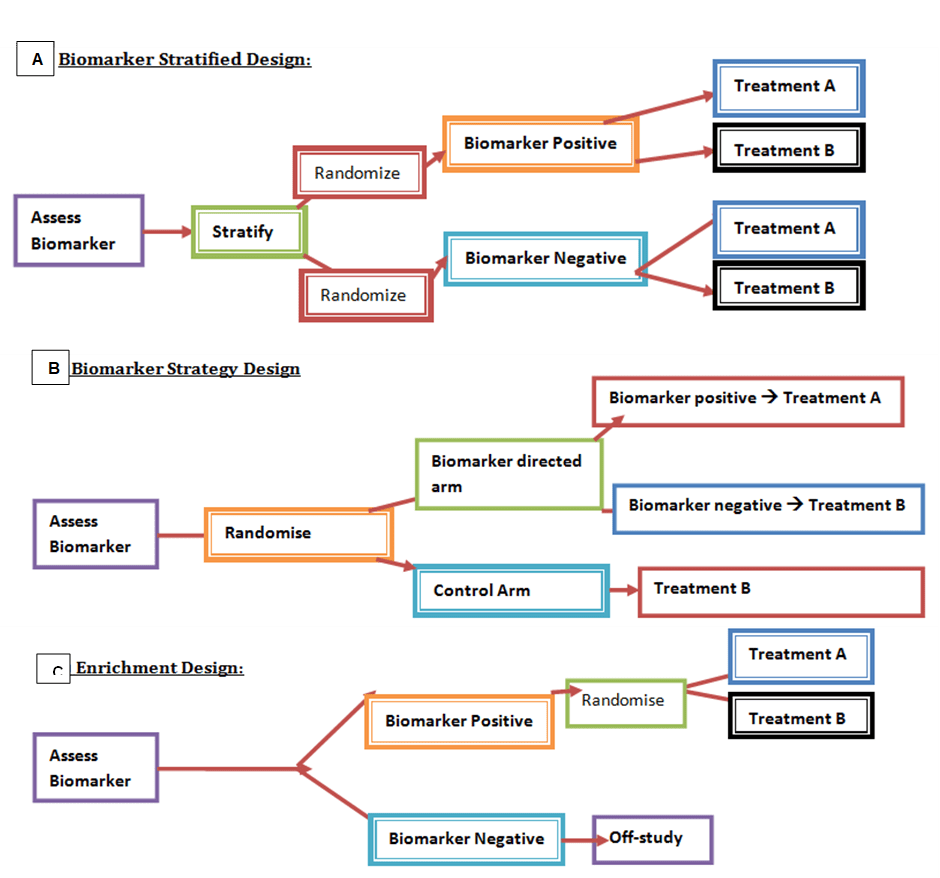
Figure 2: The main types of RCT designs. (A) Biomarker-stratified medicine: stratify followed by randomization where patients are differentiated into biomarker positive or biomarker negative, and depending on which group a particular treatment is give. Biomarker -strategy design: (b) to assess biomarker randomisation takes place, those on the biomarker-directed arm are divide into biomarker positive and negative where they differ in treatment, however the control arm has only one plan (c) Enrichment design: Those that are biomarker positive undergo randomisation where a treatment will be given, whereas those that are biomarker negative are off-study.
Amongst the therapeutic modalities applied in NSCLC cases is targeted therapy that aim at specific cells. Here, in the Marker Validation for Erlotinib in Lung Cancer (MARVEL) trial, second-line advanced NSCLC patients underwent the biomarker-stratified medicine strategy where they were allocated randomly to either treatment: the multitargeted antifolate Pemetrexed or the reversible first-generation EGFR tyrosine kinase inhibitor, Erlotinib.
Erlotinib targets both wild-type and mutated EGFRs, they have a pivotal role in cellular differentiation, angiogenesis, and proliferation. The efficacy of Erlotinib is determined via thorough investigation and a narrow therapeutic index (Carter and Tadi, 2024). It elucidates its effects in three respective ways: as a first-line agent, Erlotinib is administered to patients with known EGFR mutation. Secondly, Erlotinib is prescribed as second-line therapy if there is no treatment response after administration of platinum-based therapy such as cisplatin and its analogues. Erlotinib can also be utilized as a third-line therapy in patients who are ‘naïve’ to both modes of action of Erlotinib and Gefitinib. A third-generation TKI may be prescribed to patients with EGFR-mutated advanced NSCLC and has shown a better overall response (Carter and Tadi, 2024).
The analysis plan in this form of RCT is then stratified via EGFR status. This is followed by qualitative analysis via fluorescent in situ hybridization (FISH) which can be a useful measure to predict sensitivity to treatment. In the FISH (+) subgroup, Erlotinib is hypothesized to be better than Pemetrexed. On the other hand, the FISH (-) subset, Pemetrexed is expected to be better than Erlotinib. This helps to examine the relative efficacy of each sub-group. However, it can beunreasonable for multifaceted therapeutic approaches and several treatments may be inappropriate for some biomarker groups (Friedlin, McShane, and Korn, 2010).
The FISH (+) underwent interim monitoring using standard superiority to determine whether there were no advantages of its use (futility/non-inferiority boundaries). If there is accumulation to a subgroup where boundaries are crossed – the trial is stopped. Similarly, FISH (-) would cease if there is strong evidence of a difference between both arms. A common superiority rule is the O’Brien-Fleming boundary where if there is a significant difference of more than p < 0.0005 for Arm A than B in the first half of the trial. The less standardized criteria were to stop in the second half of the trial (O’Brien and Fleming, 1979; Jennison and Turnbull, 2000).
Non-inferiority trials suggest that a standard treatment can be replaced by a lesser treatment. This is commonly done when evaluating the toxicity of standard chemotherapy without losing the efficacy status. A study can be halted if Arm A is inferior or non-inferior to Arm B. In inferiority cases, it helps to minimize if patients are not going to get effective therapy. On the other hand, more conservative interim monitoring is needed in non-inferiority cases. This may hold important information in understanding the risk-to-benefit ratio when both arms are receiving effective therapy (Friedlin, McShane, and Korn, 2010).
Biomarker-strategy medicine with a control arm
Biomarker-strategy design is another form of RCT that has been extensively studied in NSCLC patients – please see Figure 2B. Patients are allocated randomly and there are two existing arms: an investigational treatment arm that utilizes predictive biomarkers to direct treatment or a control arm that does not directly treat. An example of this can be seen with Excision repair cross-complementing 1 (ERCC1) as a biomarker. It is linked to the resistance to the platinum anti-cancer drug cisplatin in NSCLC. Patients are assigned randomly to the control arm. This is where they will be given two treatments: docetaxel and cisplatin. However, patients may be allocated to the biomarker-strategy arm where they are altered to gemcitabine and docetaxel regimen rather than being categorized as cisplatin-resistant. Patients who are not resistant to cisplatin and have high sensitivity undergo the standard treatment which is composed of cisplatin and docetaxel (Friedlin, McShane, and Korn, 2010).
Having a control arm in a biomarker strategy design can be used in complex therapeutic approaches where there are various treatments or biomarkers. It can help equipoise and minimize differences between arms and can lower the rate of rejecting the null hypothesis. For instance, in the ERCC1 trial, 57% of the biomarker-strategy arm (treatment) were assigned to the same cisplatin and docetaxel as those in the control arm. However, such a method can cause delays due to sample size and may surge the probability of missing a valuable biomarker (Friedlin, McShane, and Korn, 2010).
Moreover, compliance is not influenced by patient knowledge status in the control arm. It can evaluate complex biomarker-guided treatment strategies with many treatment options. This helps to withhold information on the biomarker status from the control-arm patients. However, biomarker-stratified should be used when feasible because noncompliance is embedded into the estimates of its design.
Knowledge of biomarkers can affect compliance to randomized treatment, patient, or the physician. This has been noticed when the biomarker is measured but not used in guiding treatment was found in biomarker-stratified RCT and the control arm of biomarker (Friedlin, McShane and Korn, 2010). This limitation can be solved by conducting a biomarker strategy RCT without a control arm.
Biomarker-strategy medicine without a control arm
In this form of RCT design, the biomarker status of each patient is withheld until the endpoint or after the study. This can work if estimates for biomarker positive and those classified as unavailability are achievable in sample size calculation. The estimated rate of unavailability should be kept small and specified on how patients are treated and analysed (Friedlin, McShane, and Korn, 2010). For instance, patients with unavailable biomarker status are removed from the study in the strategy arm. On the other hand, this can lead to bias as the strategy arm cannot be used to be compared with the control arm. Issues of interpretation and generalization can also arise even if the unavailability rate is not high or leads to a prognosis. Further studies on unavailable biomarkers can be achieved to see whether the prognosis varies (Friedlin, McShane, and Korn, 2010). This helps to overcome missing biomarkers.
There are also other disadvantages of missing biomarkers in a biomarker strategy RCT. For instance, there could be a risk of insufficient amount, quality, handling, and storage of the specimen. The tumour may also be inaccessible or small to undergo biopsy. As a result, this can increase the failure rate of assays, degradation, and false results. For improvement, the removal of quality samples for biomarker analysis from reliable sources can diminish risks for patients. This will require a dire need to design and validation of protocols for procedures (Friedlin, McShane, and Korn, 2010).
Moreover, even if the biomarker status is withheld, the biomarker can correlate with clinicopathological features that can influence treatment preference. For example, EGFR mutation status may show a connection prognostically with a particular race, gender, and type which has been discovered to be Asian, female, and adenocarcinoma respectively (Tsao et al., 2006). However, it can lead to bias in utilizing an EGFT TK inhibitor. Therefore, noncompliance may still not be evaded even if the information is withheld (Friedlin, McShane, and Korn, 2010).
Nevertheless, there are other positive strengths in conducting an RCT without a control arm in the biomarker assessment. The study is more focused and serves as an economic advantage in biomarker design because the patients randomly assigned to the biomarker strategy arm limit investigations of expensive biomarkers (Friedlin, McShane, and Korn, 2010). This advantage surpasses the use of biomarker-stratified design because not all biomarkers can be evaluated in a biomarker-stratified design despite randomizing patients between all possible treatments. Nevertheless, some of these treatments are not suitable for some patient subsets. This emphasizes the clinical relevance of biomarkers in cancer treatment and the aim of having the right therapy for the right patient (Friedlin, McShane, and Korn, 2010).
Furthermore, a positive trial may not demonstrate biomarker use despite biomarker-positive subpopulation with the hope of the experimental arm being better than the control arm. Instead, it helps to address the optimal treatment for all subsets biomarker-positive and biomarker-negative (Friedlin, McShane, and Korn, 2010).
Enrichment RCT and the use of haematological malignancies as a model
The third type of RCT is enrichment design which evaluates all patients; however, the analysis plan is stratified to specific patients with definite biomarker values. For example, in the CALGB-10603 trial, a predictive biomarker was introduced into acute myeloid leukaemia (AML) patients with Fms-like tyrosine kinase 3 (FLT3) mutation. FLT3 is a member of the receptor tyrosine kinase factor. This mutation is ca. found in a third of newly diagnosed patients and is associated with increased relapse and low survival rates (Kennedy and Smith, 2020).
The normal function of the FLT3 receptor is to complementary join the FLT3 ligand. The activation state facilitates several cellular events, like proliferation, apoptosis, and differentiation. The most common genetic aberration in AML consists of a point mutation in the tyrosine kinase domain where phosphorylation commonly takes place. The presence of internal tandem duplicates arises in 25% of cases of patients (Kennedy and Smith, 2020). In the mutated states, proliferation potential is at a mass level stabilizing the active kinase.
The annual incidence rate of AML is ca. 3100 (National Health Service, n.d.). It is derived from two types of white blood cells, monocytes, and granulocytes, that originate from myeloid stem cells (National Health Service, n.d). Initial symptoms like paleness, lethargy, loss of weight, dyspnoea, increased frequency of nose bleeds, and infections begin in the first few weeks before they get worse. Factors such as increased age (over the age of 75), previous chemotherapy, radiotherapy, where there is radiation exposure, inhaling chemicals, smoking, and genetic disorders, can commonly increase the risk of AML. With such symptomatology and risks, immediate treatment is needed before aggressive haematological malignant phenotype may occur (National Health Service, n.d).
Subjects with FLT3 mutation enrolled in the study are assigned randomly to two types of treatment: normal and the FLT3 kinase inhibitor midostaurin. However, the control group without FLT3 mutation is in off study. Amongst the advantages of utilizing the enrichment design is the small size of the sample. In contrast, it requires a potent biological basis and the biomarker may not be identified correctly the sub-group that would gain. This RCT is favoured more than biomarker-strategy but the latter is more efficient. The degree of efficiency for enrichment design could be relatively increased if the biomarker status is regarded. Simultaneously, the biomarker-stratified is also favoured more than the enrichment as there needs to be a form of confidence and certain that the biomarker can help identify the subpopulation of patients. This carries a risk because if the biomarker used for enrichment does not identify the group that benefits then the beneficial therapy could be abandoned mistakenly (Kennedy and Smith, 2020).
However, more recent studies have discovered that the second-generation FLT3 inhibitors are more specific as they target the FLT3 as single agent therapy. Type I inhibitors can antagonize the FLT receptor in its inactive and active form. On the other hand, quizartinib a rare type II inhibitor can only target the FLT in its inactive form (Kennedy and Smith, 2020). The relative success of these inhibitors is temporary and there is a challenge of resistance intrinsically through downstream signalling events notably Ras and associated PI3K/Akt/mTOR and MAPK/Erk pathways. Extrinsic mechanisms of action are exercised through metabolic pathways and bone marrow microenvironment during the administration of chemotherapy intravenously (Kennedy and Smith, 2020). These proposed mechanisms are involved in the preselection of subclones and can be overcome by combination chemotherapy.
Several Phase I and II trials have investigated the impact of midostaurin and hypomethylating agents HMA in adults with FLT mutation. However, participants were unfit for traditional chemotherapy in the frontline which opened to further investigation. Alternatively, due to the inferiority, it was terminated due to accruing. The current trial aims to evaluate midostaurin and azacitidine a type of HMA with primary endpoints of tolerability and overall response rate in patients newly diagnosed with AML with and without FLT mutations hypomethylating agents (Kennedy and Smith, 2020).
Genetic aberrations help to stratify targeted therapy
Middleton et al. (2022) summarised three groups in how genetic aberrations can help stratify targeted therapy. The first category consists of gene rearrangements of ALK, RET, NTRK, ROS, and mutations of receptor tyrosine kinase EGFR, MET exon 14, and downstream signalling intermediates such as PI3K/AKT/mammalian target of rapamycin (mTOR) and RAS/RAF/ERK. This helps increase the progression of cancer and improve cell survival and proliferation.
A small subset of lung cancers is caused by a genetic mutation that fuses ALK and EML4. Crizotinib specifically targets this fusion protein but was discovered to be ineffective in 96% of patients whose cancers are caused by alternative genetic drivers of mutation (Bell, 2014). This highlights the increasingly personalized approach of having the right therapy for the right patient, dose, and at the right time.
Another key example is the BRAFV600E mutation harboured in 50% of patients with metastatic cutaneous melanoma. This leads to the activation of the mitogen-activated protein kinase (MAPK) pathway. Vemurafenib targets the BRAF protein to halt its effects (Davies et al., 2002; Curtin et al., 2005). This emphasizes how a single-agent small molecule inhibitor can directly target the aberrant gene rather than the downstream pathway. There was a 63% relative decrease in death and 74% in disease progression (Chapman et al., 2011).
Similar results were found in selective BRAF inhibitor dabrafenib which has been widely approved (Hauschild et al., 2012). Recent studies evaluated the efficacy of dabrafenib and MEK1 inhibitor trametinib in patients with BRAFV600E activating mutation after the progression of standard therapy. Salama et al. (2020) discovered that 38% of patients with BRAFV600E mutation had a median progression-free survival of 11.4 months. This implies there was a high rate of disease control. In contrast, the low activity of BRAF/MEK-targeted therapy in NSCLC indicates that the efficacy is histology-dependent. Hypothetically, the underlying resistance to therapy may be associated with the EGFR reactivation of MAPK (Corcoran et al., 2012).
The second group consists of overexpression of cell surface proteins. A key example is the HER2 gene amplified in patients with breast cancer and gastric cancer. Therefore, HER2-positive cancers are targeted by HER2 monoclonal antibodies (Middleton et al., 2022; Bell, 2014). This suggests how HER-2 protein as a prognostic factor led to the development of the monoclonal antibody Trastuzumab (Herceptin) to improve patient outcomes. Evaluations of its efficacy were trailed where subjects recruited were women with HER-2-positive cancers. This led to late clinical trials confined to HER-2 positive patients and not those who were HER-2 negative who were given alternative treatments. This demonstrates the essentiality or eligibility for Trastuzumab to elicit its effects (Bell, 2014). Upon the assessment of health technology, services, and knowledge are also key steps in clinical trials before healthcare delivery. However, it is important to state that even though HER2 is a stratifying diagnostic and prognostic marker. It reflects a somatic change in the tumour rather than transmission of a germ-line mutation. Similar to BRCA1 and BRCA2 whose status is disputed (Day et al. 2016).
The third group can identify drug targets through synthetic lethal interactions. A key example is how poly (adenosine diphosphate-ribose) polymerase (PARP) inhibitors treat cancers associated with BRCA1 and BRCA2 genes, namely, breast and ovary. However, the clinical translation of synthetic lethality varies in the targets identified in the varied synthetic lethal screens. The loss of ARID1A was a key target to help examine the sensitivity to ATR inhibitors. The only ARID1A-mutated/BaF250A-negative endometrial cancer patient had no response to ceralasertib despite having an ATR mutation. This synthetic lethality is likely due to cancer subtype context-dependent (Middleton et al., 2022). ARID1A-mutant cancers that have no loss of protein by immunohistochemistry present no advantage when treated with combined targeted therapy, Ceralasertib, and Olaparib. Immunohistochemistry is a technique where antibodies are bound to specific molecule which is commonly a cell-surface protein and have a unique colour appearance under microscopic analysis. Examples of cancers where this technique was performed were breast cancer using the oestrogen receptor biomarker. Another example is PD-1 ligand that can be used to direct antibody therapy for patients with colorectal cancer and melanoma. This emphasises how techniques such as immunohistochemistry can be routinely used in contrast to genomic, proteomic and metabolomic analysis to stratify cancers.
Nevertheless, these three groups that originally guided stratification to genotype-matched therapy will not have significant new outcomes. A more contextualized stratified medicine is needed to overcome genomic complexity and instability that results in targeted therapy failure in complex cancers. To maximize outcomes, preclinical models will help increase accuracy (Middleton et al. 2021).
The revolutionary concept of Next Generation Sequencing
Progressing forward, recent biomarker studies have undergone genomic screening for NSCLS (Cerone et al., 2023). Collaborative efforts between the National Health Service (NHS), Cancer Research UK, and pharmaceutical companies (Pfizer and AstraZeneca) who identified processes and implemented changes to maximize screening success to 79% via the first clinically available next-generation sequencing (NGS). NGS is a revolutionary high-throughput technology that produces large whole genomic sequencing of genetic material, deoxyribonucleic acid (DNA), or ribonucleic acid (RNA) through speed and scalability where multiple genes are assessed in a single assay (Illumina, 2025). It holds multiple applications in genomically understanding the cause of disease and transforming personalized medicine.
The study took place between January 2015 and August 2021 where 10,000 patients from more than 50 hospitals and different socio-economic backgrounds consented to the SMP2. The project aimed to create a single assay that was able to detect genetic aberrations involved in NSCLS by sequencing tumours, matching normal blood samples, and detecting single nucleotide variants (SNV) and indels (insertions and deletions in the genome) > 10% frequency and Somatic copy number alterations (SCNA) in samples with > 60% tumour content (Cerone et al., 2023). This was necessary to be eligible for the National Lung Matrix Trial (NLMT).
The SCNA has contributed to the tumorigenesis of a plethora of cancers by affecting DNA replication and transcription factors of target genes. It alters the spatial arrangement of the genome and chromatin. Consequently, it delays the timing of DNA replication and decreases genetic expression. This renders DNA replication and stimulates the production of Double Strands Breaks (DSB) at fragile nuclear sites (Harbers et al., 2011). The constant enrichment of cancer-associated deletions and <20 Mb amplification induced by SCNA creates genetic instability. Thus, it provides prognostic information on the level and type of genetic aberration entailed within the tumour. This may influence novel therapeutic modalities. High expression of SCNA can influence DNA repair pathways. This further signifies the need to explore the role of SCNA which Harber et al., (2011) described as the Achilles heel of tumours.
A genomic study conducted by Fawdar et al., (2013) discovered three kinases through a targeted genetic dependency screen that have gain-in-function mutations in lung cancer mediating towards ERK pathway: PAK5, FGFR4 and MAP3K9. Targeted depletion of mutated kinases prevent proliferation, inhibit downstream signalling events, and eradicate lung cancer cells (Fawdar et al., 2013). This presents a technique in how to effectively identify somatic variants that help with NSCLC progression.
To establish the genetic markers and progress to the NLMT, the initial step was to test a set of 6787 samples whilst undergoing the first line of the standard of care (SOC) treatment. 84% of subjects (5711) passed the quality control because they had sufficient genetic material as part of quality control (QC) criteria after close monitoring and optimization. The subsequent step involved demonstrating the wild-type status of target genes. 79% of patients were confirmed (5355) because the remainder (356) failed the next-generation sequencing (NGS) stage where >10% of samples failed to identify 28 target genes. After all, the threshold for the sequencing coverage was unmet and had a significant effect. Amongst the key examples that failed was the retinoblastoma gene (RB). The threshold was set at 20% tumour content and 500 reads for a minimum of 85% exons. This further emphasizes the importance of critical factors of sample handling, processing, sample quality, and logistics (Cerone et al., 2023).
As a consequence, the SMP1 was upgraded to SMP2 by additional probes to improve the coverage of genes that entail the highest failure rates. There were a few limitations on the repetition of introns and the SCNA was also investigated. Both further studies helped identify blood-tumour mismatches. A third study was also incorporated alongside SMP1 and SMP2, the TruSight Tumour 170 assay (TST170) helped to enable the gene fusion of DNA and RNA. However, this did not require the sequencing step of the matched blood samples (Cerone et al., 2023).
Following analysis, 52% of patients (3537 subjects) were eligible for the Matrix trial. However, the final cohort of the NLMT comprised 404 patients. This was due to death at the time of closure, poor performance or their health status cannot bear the level of toxicity. The main drivers of sequenced genes had several aberrations: SNV, insertion, deletion (INDEL), and amplification (Cerone et al., 2023).
Alternatively, the TST170 did not efficiently work like SMP2 (SMP2v02) in the SCNA analysis. Upon establishing the reason, some genes were amplified or deleted in the NSCLC patients. On the contrary, the TST170 positively increased the speed of detecting gene fusions from samples limiting the need for FISH and TAT techniques. This has been especially observed for CDKN2A, PIK3CA, FGFR3, MET, and STK11 which were highest for SMP2. The role of Serine/threonine kinase 11 (STK11) is a gene that encodes a tumour suppressor protein and regulates cell polarity. A range of STK11 mutations may occur: missense, nonsense, silent, whole gene deletions, frameshift deletions, and insertions in NSCLS, gastrointestinal cancer, and cervical cancer – please see Figure 3 (My Cancer Genome, 2017).
The sensitivity of the gene detected was minimally detected via SCNA and TST170 (43) in comparison to SMP1 for the CCND family, Phosphatase, and tensin homolog deleted on chromosome ten (PTEN) and EGFR. The CCND1 gene encodes the Cyclin D1 protein that complementary binds to cyclin-dependent kinase 4 (cdk4). This helps to control proliferation in the nucleus and migration in the cytoplasm (Fuste et al. 2016). High levels of Cyclin D1- cdk4 can arrest proliferation which halts Ras-driven neoplasia. It regulates and favours cellular migration by phosphorylating cytoplasmic Paxillin (Pxn) molecules and regulating two small Rho GTPase enzymes, RhoA and Rac1 in an opposite manner (Fuste et al. 2016). Downregulation of the CCND1 inhibits the metastatic potential of cells in in vivo models.
PTEN is a tumour suppressor that was lost from the chromosomal regions 10q23 (Hopkins et al., 2015). It is downregulated by promoter methylation and can be sequenced by the expression of microRNAs in NSCLC, brain, gastric, breast, thyroid, and gynaecological cancers (Song, Salmena and Pandolfi, 2012). It is a protein and lipid phosphatase enzyme that normally functions in phosphatidylinositol 3 kinase (PI3K)-independent and dependent manner. From a PI3K-dependent perspective, PTEN hydrolyses its primary cellular substrate phosphatidylinositol (3,4,5) trisphosphate (PIP3) to phosphatidylinositol (4,5) bisphosphate (PIP2). This antagonizes the phosphatidylinositol 3 kinase (PI3K) signalling pathway by halting PIP3-dependent processes, for instance, membrane recruitment. It also negatively regulates PIP-dependent moieties, for instance, Protein Kinase B (AKT) and Phosphatidylinositol Dependent Kinase-1 (PDK1). Therefore, inhibition of growth, protein synthesis, cell cycle progression, migration, and metabolism occur. This increases the apoptotic rate and cell cycle arrest. It also demonstrates the ability of PTEN to constrain the oncogenic transformation.
Moreover, there is key evidence in glioma cells where PTEN phosphatase activity can increase migration and suppress the Src family kinases (Dey et al., 2008). Conversely, PTEN can also function independently from the PI3K pathway where it prevents migration, induces genomic instability, dysregulates the cell cycle, and decreases transcription of genes. This reveals the subtle alterations of PTEN on tumour susceptibility, normal development, and disease to maintain homeostasis.
This further emphasizes how SCNA can identify patients where amplification or deletion with indicated genes. CDKN2A loss and CCND1 amplification, sensitize cancer cells to the effects of cdk4 inhibitors (Gong et al., 2017).
Approximately, 88% of samples were able to achieve 50% of the candidate driver genes in the NLMT. This is highly significant in comparison to genes assessed in the first SMP1 (SMP2V01) with 65% (p<0.01) and SMP2 (SMP2v02) with 73%. These sequencing results identified the structure of the variant and helped to determine whether these genes are amplified and which chromosomes are mutationally rearranged (Chromothripsis). This highlights the advances and functionality of Next Generation Sequencing and the clinical outcomes whose flexibility varied in the type of panel and analysis.
Moreover, further concentrated efforts took place to identify additional oncogenic drivers that can be usefully treated with genotype-matched targeted therapy (Middleton et al. 2022). The NLMT trial was incorporated with other clinical trials NCI-MATCH, LUNG-MAP [concentrating on squamous lung cancer (LUSC)] studies where they screened over 13000 patients and between them identified 38 matched biomarker-drugs cohorts. This illustrates the effectiveness of teamwork.
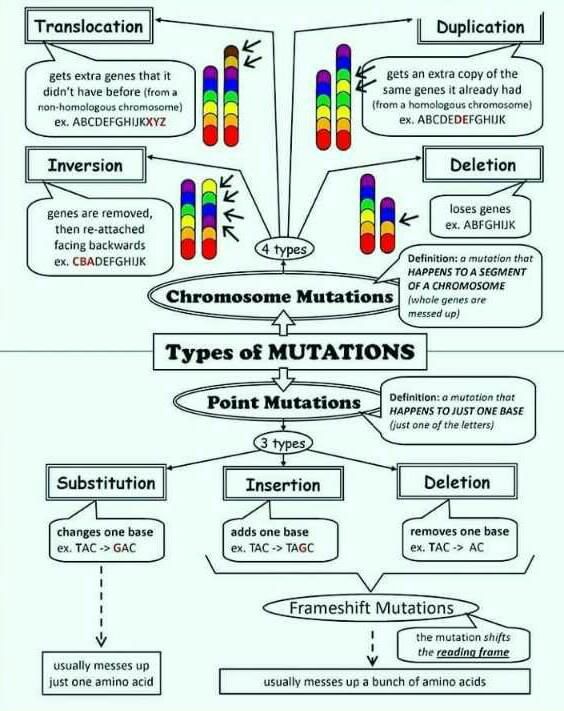
Figure 3: Types of mutations that may arise in genetic aberrations
Microarrays and its role in stratified medicine
Genomic analysis using deoxyribonucleic acid (DNA) and ribonucleic acid (RNA) microarrays can help stratify cancers. Microarrays consist of RNA or DNA fragments from genes, arranged in the form of biochips that feature a sequence of DNA spots on a solid surface. It quantifies the amount of corresponding DNA or RNA in the provided sample (Rafii, Hassani, and Kbir, 2017). Therefore, genetic variants or expression levels of disease-related genes simultaneously provide insight into key differences in transcriptional activity between cancerous and non-cancerous tissues. This helps to understand the molecular mechanisms that drive carcinogenesis, and progression and helps improve diagnosis and treatment strategies.
The DNA microarray application has a series of sequential steps – please see Figure 4. At first, the sample tissues are collected from cancerous and non-cancerous tissues. RNA is a single polypeptide extracted from a tissue. Most commonly, the messenger RNA (mRNA) is isolated using a column or pheno-chloroform solvent. The circulating DNA (cDNA) label is formed and hybridized to associate with both tissues mounted on a microarray plate. Hybridization is where probes and labels of DNA or RNA are based paired on the plate. This is achieved through the employment of optical, electrochemical, or mass-sensitive devices (Raffi, Hassani, and Kbir, 2017). For example, the reserve transcribed messenger RNA is labelled with fluorescent dye from the sample (target) and is co-hybridized on the microarray (Virtanen and Woodgett, 2008).
The excess solution from the hybridization array is diminished through washing. The washing of the non-specific or non-selectively bound fluorescent cDNA decreases the sensitivity of the whole microarray. Under the scanner, the detection of genes in the hybridized image of the microarray is established via relative densities of fluorescence at high resolution (Hambali et al, 2020). It helps to quantify the amount of fluorescent signal over the surface because the location of the gene probes is predetermined. Therefore, the relative or absolute quantification of RNA for each of the genes can be known. This summarises the method of how microarray measures the level of mRNA transcripts in a sample (Virtanen and Woodgett, 2008).
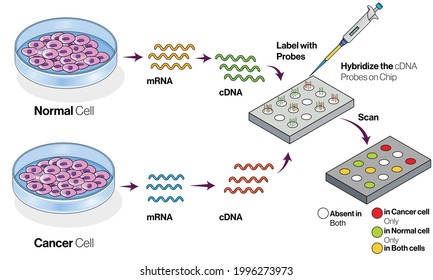
Figure 4: Key steps in microarray application
Moreover, the analysis of DNA microarrays can be dichotomized into supervised and unsupervised methods. It involves two key terms: class and known class. Class refers to characteristics shared between one group of samples that cannot be found in other samples. For instance, cancerous versus non-cancerous tissues. A known class is differentiating characteristics that can label tumour samples under study a priori the data analysis. Supervised methods identify molecular signatures with known classes whilst unsupervised methods help to discover new classes because samples are not labelled and belong to different clinicopathological classes before data analysis (Perez-Diez, Morgun, and Shulzhenko, 2013).
A 1999 research study analysed 38 bone marrow training samples extracted from acute leukaemia patients. They were initially grouped into subtypes: 11 AML and 27 acute lymphoblastic leukaemia (ALL) before several diagnostic techniques were performed. The supervised method discovered that 50 genes were differentially expressed between the subtypes with roles in cellular regulation, transcriptional activity, and adhesion. The 50 genes were later used as a predictor set to further test 34 new leukaemia samples independently collected from training samples. 85.3% (29/34) of the test set were correctly classified. This demonstrates the diagnostic value that can be applied in larger training sets and its significance in comparison to existing methods of diagnosis.
On the other hand, unsupervised methods can be explained through the 1999 acute leukaemia study. The aim was to determine whether global gene expression can analyse and distinguish between AML and ALL. This was achieved using self-organizing maps (SOM) where specific classes can be identified and set in two. Results discovered 96% (24/25) were clustered in one group whilst 76.9% (10/13) AML samples were clustered in another. This helped uncover new taxonomic subclasses besides morphological or phenotypical tests.
Another successive study in class discovery analysis of AML can be established when a larger scale study is used. 35 to 50% of patients presented normal karyotypes with unpredictable prognosis. There were 116 samples from AML and 45 normal karyotypes. All 45 normal karyotypes were further divided into two groups with diverse survival rates. This highlights the clinical and prognostic value of the new AML classification (Perez-Diez, Morgun, and Shulzhenko, 2013).
Furthermore, Roepman et al. (2005) revealed how in primary head and neck squamous cell carcinomas (HNSCC), a gene predictor was able to detect local lymph nodes. There were 102 genes in the predictor set with a predictive accuracy of 86% in comparison to current diagnostic methods that held 68% accuracy. This highlights improvement in diagnosis and relevance to treatment selection. Moreover, 75% of patients were metastasis-free but were diagnosed with carrying possible metastases and could have avoided radical neck dissection treatments. This further signifies improvements in diagnosis and how genes are differentially expressed in two classes of primary HNSCC local metastases and those without local metastases. 50% of 102 genes formed by the predictor have an unknown role in metastasis and could provide further insight into HNCC pathogenesis (Perez-Diez, Morgun, and Shulzhenko, 2013).
Advantages of utilising microarray in cancer studies
The expression of genes alters over time in response to environmental conditions: hypoxia and exposure to treatment. This can cause challenges when classifying tumours because of the similarity in the histological features but differences in genetic and molecular information. However, through microarray-based classification, the gene expression is compared to the references to infer the identity with high accuracy. This improved the diagnosis of unknown primary origin and prediction.
Another advantage is the ability of the microarray application to examine a plethora of genes from a single experiment and cell functionality for cancer, diabetes, neurological disorders, and Alzheimer’s disease (Hambali et al., 2020).
Microarray expression profiling can be used in several cancers to determine pathological subtypes and predict responses to therapeutic outcomes. Key examples are haematological malignancies, lung, breast, kidney, and other neoplasia’s. From a bedside perspective, molecular profiling appears to be a potential technique to identify biomarkers in renal cell carcinoma by analysing protein and gene expression. This aids in decision-making for kidney cancer patients and develops novel targeted therapeutic responses. The patient undergoes surgery and a biopsy of the cancerous tissue is removed for pathology assessment and molecular analysis. This helps to screen for susceptibility, and recurrence and helps classify the tumour type, and aggressive behaviour to help identify the treatment options in an individualized manner.
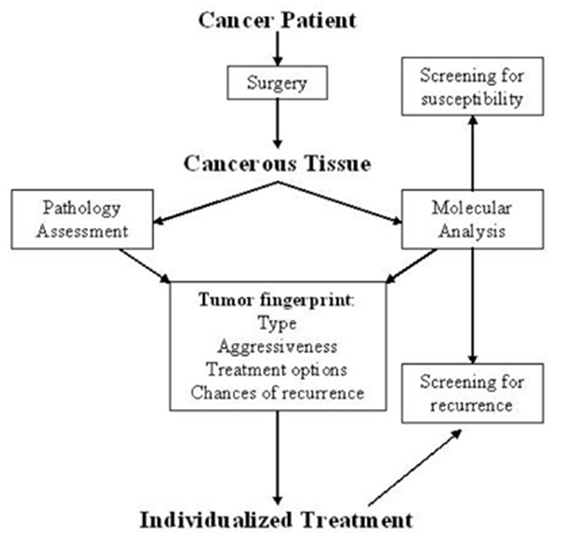
Figure 5: Molecular Profiling intervention in decision making for kidney cancer patients.
An additional value of using microarrays is to help define gene signatures for proliferation and how they can be augmented to groups according to pathways (Golub et al., 1999; Alizadeh, 2000; Ramaswamy et al., 2003; Rhodes and Chinnaiyan, 2005; Segal et al., 2005). For example, Glinsky et al., (2005) derived 11 gene signatures from in vivo mouse and human prostate tumour models. It held a stem-cell type expression that predicted poor outcomes for multiple cancer types. This may hold biological information about cancer generation or progression.
Disadvantages of microarrays in cancer studies
One of the drawbacks of DNA microarray data is the presence of genes that lack relevance to the diagnosis. High dimensionality and small sample size can also contribute to affecting the classification of disease. For example, seven published microarray data were used to predict cancer patients. However, 71.4% (5/7) of the datasets had poor classification.
Recent approaches of machine learning, data mining, and computational intelligence algorithms have helped overcome these drawbacks and augment the predictive accuracy of cancer diagnosis, lowering the cost of identifying target genes (Bennet, Ganabrakasam and Kumar, 2015; Alomari et al., 2017; Saqib et al., 2020). On the other hand, the method depends on the domain application and how distinctive the data set is. They are either classified into clusters by simultaneous patterns or assigned unknown cases to pre-classified samples (Selvaraj and Natarajan, 2011).
In contrast, limiting the genes presented can also influence research. MammaPrint, a microarray-based diagnostic technique can examine genetic variants in breast cancer tissue to estimate the possibility of metastasis. However, microarrays are limited because they can only assess genes presented there. DNA microarrays will potentially be substituted with whole genome sequencing due to the benefit of obtaining complete information, whereas RNA microarrays remain valuable for exploring gene expression.
Nonetheless, these refined approaches in analysis microarray studies published in the literature do not fully accept this technique for diagnosis and how human cancers are classified (Perez-Diez, Morgun, and Shulzhenko, 2013). However, as a combined diagnostic method alongside others, helps to identify new markers and classify tumours into new taxonomic categories.
Additional limitations have been addressed, for instance, an individual tumour cannot be classified independently and requires to be compared to known standards that were analysed under similar conditions (Perez-Diez, Morgun, and Shulzhenko, 2013). From one perspective, it is a critical step to maintain experimental conditions from preparation to analysis in the original and predictor set to avoid complexity. However, interlaboratory comparability can be applied where despite the difference in the laboratory, if one applies the technical conditions and method for repeatability, there would be a high correlation between the gene expressions (Perez-Diez, Morgun, and Shulzhenko, 2013).
There has been mounting evidence that real-time polymerase chain reaction (RT-PCR) can validate microarray profiles to identify diagnostic markers yielding slightly different results. Upon reasoning, the global normalization procedure used in microarrays is more precise than RT-PCR. If a few control or housekeeping genes may show variation in their expression, it is not significantly affected in microarray as in RT-PCR.
Nevertheless, the microarray can be translated into RT-PCR diagnostic profiles. This can be observed when analysing 36 genes by RT-PCR which aided in predicting survival in diffuse large B cell lymphoma based on microarray data. 16.7% (6 genes) were the strongest predictors used to differentiate between different survival groups (Welsh et al., 2001). As opposed to techniques that are antibody-dependent and detect proteins quantitatively like immunohistochemistry and ELISA, RT-PCR can help easily translate microarray profiles and detect mRNA of genes rapidly. This does not eradicate the importance of analysing the protein in tissue and serum.
A key tissue marker identified from four independent microarray datasets is alpha-methylacyl CoA racemase (AMACR) (Rubin et al., 2002). AMACR is overexpressed in prostate cancer compared to its benign nature. The mRNA and protein levels were measured using RT-PCR and immunoblot correspondingly and were analysed subsequently using immunohistochemistry to evaluate their clinical use. It had good specificity (100%) and sensitivity (97%) for all subjects with prostate cancer, especially in challenging cases that needed multiple expert opinions (Perez-Diez, Morgun, and Shulzhenko, 2013).
A multi-step approach was applied genomically, proteomically, and at tissue levels to identify diagnostic biomarkers used to distinguish between ovarian and colon adenocarcinomas (Nishizuka et al., 2003). It revealed villin as a candidate for colorectal and moesin proteins for ovarian with high sensitivity and specificity. Overall, it suggests the importance of microarray in oncology practice to improve diagnostic methods to identify novel markers in neoplastic transformation and progression.
Metabolic and protein analysis and its role in stratified medicine
Microarrays can be employed when antibodies bind to a desired metabolite or protein variant. In comparison to genomics, both proteomic and metabolic analyses provide more information on molecular mechanisms involved in a disease. A combination of their data, genomics, and clinical outcomes indicates the impact of systems biology in measuring the pathological and normal states of the cell (Schmidt et al., 2021). It also suggests the application of biomedical and health informatics on progress in stratified medicine. Nevertheless, storage conditions can influence results despite the accessibility and extraction of the molecule.
Reprogramming of metabolic pathways in cancer cells enhances the proliferation rate and survivalism (Iqbal et al., 2023). Inflammatory mediators and metabolic drivers can increase tumourigenesis by stimulating reactive oxygen species (ROS) and influencing signalling pathways. The increased level of oncogenic mutations and intrinsic modification of chromatin and epigenetic dynamics and extrinsic factors contribute to altered metabolism. Levels of nutrients, drugs, hormones, and complex interactions with the immune cells, stromal cells, and extracellular matrix exacerbate the hallmark of cancer (Reid, Dai, and Locasale, 2017; Elia and Haigis, 2021).
In the 20th century, metabolic reprogramming was initially observed by Otto Warburg. He discovered that tumour cells increase the uptake of glucose and produce high levels of the metabolic end-product lactate in the presence of oxygen (Warburg, Posener, and Negelein, 1924; Warburg, 1956). Cancer cells can maintain the balance of redox cofactors by converting pyruvate to lactate (Van der Heiden and DeBerardinis, 2017). Lactate is recycled to form glucose in the liver through the Cori cycle (Cori and Cori, 1925). This signifies the purpose of systematic measurements of metabolites and hormones in clinical laboratory tests and imaging tests.
Metabolomics – a research technique
The global study of small molecule metabolites with a molecular weight of 1500 Daltons and below in biological specimens is referred to as metabolomics (Wishart et al., 2012). They are similar to other omics technologies that provide cancer information (Schmidt et al., 2021).
A diverse range of biofluids used in the metabolomic analysis are: blood, serum, plasma, urine, sputum, saliva, cerebrospinal fluid, sweat, tears, breast milk, bile, prostatic secretions, amniotic fluids, bronchial washing, and faecal water (Schmidt et al., 2021). Surgical specimens like biopsy have also been evaluated which highlights the plethora of clinical material used to study metabolites for biomarker discovery and hypothesis testing in translational settings. However, they differ in the method of sample collection, processing, and storage because depending on the type of sample, rapid changes to the chemical structure of the metabolic enzymes and molecular oxygen. This is overcome using quality controls to minimize the risk of chemical decomposition (Schmidt et al., 2021).
Thus, the detection of biomarkers is conveniently studied in the blood, serum, urine, saliva, and sweat. A lung cancer screening trial discovered the application of exhaled breath to detect cancer biomarkers where volatile organic compounds present in the source had high sensitivity (72-90%) and specificity (83-94%) can help different patients with NSCLC and non-cancerous in comparison to a low dose of computed tomography (CT) and other imaging modalities (Phillips et al., 1999; National Lung Screening Trial, 2013).
The leverage of Liquid Chromatography-Mass Spectrometry (LC-MS) was extensively used in the study of metabolomics – please see Figure 6. The LC stage is where a sample of liquid containing metabolites passes through a solid-phase column. It is divided based on their chemical affinity for the solid phase. All the metabolites are eluted from the column. This increases the sensitivity to detect abundant metabolites and the time needed to separate complex biological samples. The MS stage is where the samples in the liquid or gas phase are injected into the mass spectrometer. The metabolites become ionized and are then divided based on the mass-to-charge (m/z) ratio of a molecule in a sample (Broadhurst et al., 2018).
However, limitations in this technique present several challenges. The metabolome requires several instrumentation platforms for investigation and multiple disciplinary researchers that may not be feasible in academic and clinical laboratories (Schmidt et al., 2021). The peak algorithms may present different results. Thus, the experimental method requires robust design and analysis of large metabolic datasets using standardized absolute measures to report across platforms. On the contrary, regardless of the release of minimum reporting standards published by the Metabolomics Society in 2007, it was not fully implemented across institutions (Llaverias et al., 2010).
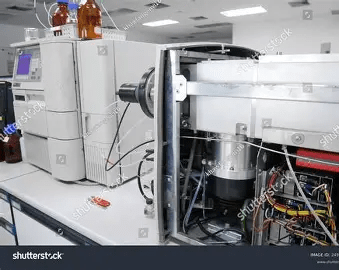
Figure 6: Liquid Chromatography – Mass Spectrometry.
Pathways involved in metabolic deregulation
Tumour metabolic heterogeneity can arise in primary tumours because of environmental factors. It commonly encompasses key metabolites and enzymes that evolve temporally and contribute to cancer-aggressive behaviours. This diminishes the efficacy and deployment of treatment and metastatic cascade (Demicco et al., 2024). Such alterations in the metabolism cause metabolic dependencies and are targeted in precision medicine and nutrition to selectively target metabolic enzymes (Luengo, Gui, and Van der Heiden, 2017; Vernieri et al., 2016).
Iqbal et al. (2023) have identified three dependent pathways when metabolically stratifying patients with breast cancer patients. This was achieved using Euclidean distance metrics that synergistically contribute to metabolic deregulation after patient stratification. The emergence of M1 had the least deregulation, M2 with moderate deregulation, and M3 with most deregulation. M1 and M2 subtypes predominantly had samples with oestrogen positive. Nonetheless, their metabolism differed where there was moderately greater metabolic deregulation with M2 than with M1. Iqbal et al., (2023) divided his experiment into two avenues: to evaluate the levels of metabolites and the transcriptomics via the METABRIC microarray data and copy number variation (CNV) data. A machine-learning approach predicted and labelled all three subtypes and 344 metabolites that represent 63 pathways were compared. There were five metabolic pathways elucidated: bile acid, methionine, glycolysis, and pentose sugars. The maximal increase of metabolites was found in M3 (Iqbal et al., 2023).
The first subtype (M1) focused on the biosynthesis of bile acids. Bile acids are organic acids found in the thick alkaline fluid secreted in the liver and stored by the gall bladder. It is intermittently released into the first segment of the small intestine, the duodenum via the common bile duct. It functions to induce non-enzymatic digestion of fats before they are further hydrolysed and digested by the pancreatic lipase into small fatty acids and glycerol. In the literature, there have been several studies that illustrated the link between high levels of fat, low serum cholesterol, and high levels of bile acid in the faeces with the incidence of colorectal cancer (Rose et al., 1974; Reddy, Mastromarino, and Wynder, 1975).
The second subtype M2 demonstrates the deregulation of the amino acid methionine. The third pathway (M3) interrelates with the aberrant metabolism of the sugar molecule glucose, nucleotide, and fatty acid. There is an increased demand for fatty acids by cancer cells to serve as signalling molecules and generate lipid membranes. The endogenous production of fatty acids can be conducted via glucose, acetate, and glutamine or via nutrition (Menendez and Lupu, 2007). This is further demonstrated by the evidence of lipogenic enzymes in cancer cells. Key examples are: fatty acid synthase (FASN), ATP-citrate lyase (ACLY), and acetyl-CoA carboxylase (ACC) (Mullen and Yet, 2015; Shah et al., 2016; Sevensson et al. 2016). They could help identify tumours that are unable to promote lipid uptake and require additional fatty acid to maintain growth and energy demand.
Increased lipotoxicity was evaded by cancer cells by overexpression of stearoyl-CoA desaturases (SCDs) whose role transforms saturated fatty acids into monounsaturated fatty acids (Ackerman and Simon, 2014). This facilitates the cancer cells to maintain the saturated to unsaturated fatty acid ratio which would otherwise induce stress in several organelles due to excess ROS in the mitochondria and endoplasmic reticulum. Cohort studies discovered that omega-6-polyunsaturated fatty acids and cancer risk were positively correlated. However, an opposing relationship was established where omega-3-polyunsaturated fatty acids were inversely associated with cancer (Harvei et al. 1997).
METABRIC data and cancer stratification
Iqbal et al., (2023) identified 40 driver mutations in the METABRIC data sets. Metabolically clustered using the Chi-squared test revealed 5 predominant genetic mutations in each cluster for breast cancer patients: TP53, PI3KCA, GATA3, MAP3K1, and CDH1. In M3 samples, Iqbal et al., (2023) discovered 80% of the samples had TP53 mutations and 24% PIK3CA mutations. This may suggest why there was a positive correlation of TP53 with nucleotide (pyrimidine) metabolism. Other metabolites showed high abundance: fatty acid, pentose, and glycolysis. This facilitates positively with mammalian target of rapamycin complex 1 MTORC1 signalling pathway and cell cycle (DNA repair and G2 to M phase checkpoint).
mTORC1 is activated by the PI3K-AKT pathway which elevates the expression of heterodimeric transcription factors hypoxia-inducible factor HIF 1-alpha (HIF1) (Duvel et al., 2004). HIF has two subunits; the alpha subunit is degraded in the presence of oxygen but the beta subunit is stabilized. This helps to adapt to hypoxia conditions and is further strengthened by increasing the expression of glucose transporters, hexokinase, and phosphofructokinase 2 (Pfk2) (Denko, 2008). Hexokinase is the first key enzyme in glycolysis. AKT is a serine-threonine kinase that activates the glycolytic pathway by directly phosphorylating hexokinase and indirectly by phosphorylating the substrates that regulate glucose transporters (GLUT1 and GLUT4) to the plasma membrane (Elstrom et al., 2004; Sano et al., 2003).
HIF also increases the production of lactate by producing pyruvate dehydrogenase kinase (PDK) that prevents pyruvate oxidation. The PI3K-AKT pathway also helps activate the oncogene Ras to soar glucose uptake. This suggests how the increase of oncogene and loss of tumor suppresses help with metabolic reprogramming as a cancer hallmark. However, insulin and other growth factors also stimulate the PI3K-AKT signalling pathway.
Furthermore, there was no positive correlation between inflammatory response with M3 nor others (M1 and M2). This renders them to be more sensitive to inhibitors of such metabolites. Key examples of inhibitors are leflunomide (pyrimidine), C75 (fatty acid) and CAP232 (glycolysis). In vitro studies presented 35% inhibition of cell growth in two M3 cell lines when treated with combined therapy: leflunomide and the anthracycline and topoisomerase inhibitor, doxorubicin.
Alternatively, the most effective inhibitor was the biologically rational drug agent Brigatinib for the M3 cell line MDA-MB-231. Brigatinib is commonly used to treat NSCLC patients with positive anaplastic lymphoma kinase (ALK)- echinoderm microtubule-associated protein-like 4 (EML4) fusion protein. This fusion protein inhibits apoptosis and proliferation via several downstream signalling events: PI3K/AKT, MAPK/extracellular-related kinase (ERK1/2), and JAK/STAT (Kumar, Ernani, and Owonikoko, 2015).
Further pre-clinical drug testing revealed M3 subtype had maximal sensitivity to GSK461364 (Polo-like kinase 1 inhibitor and overexpressed in triple-negative breast cancers (Salama and Khairy, 2021). This form of cancer is negative against oestrogen receptor (ER), progesterone receptor (PR), and HER2. Hence, there are limited therapeutic modalities and low survival rates. The Polo-like kinase 1 protein (PLK1) regulates cell division and was observed in 91.9% of cases. High-grade tumours had a 76.9% high score showing lymph node metastasis and are proposed as a novel therapeutic target.
In contrast, M1 subtype samples had the best prognosis. 15% of the samples had TP53 mutations and the highest subtype with PIK3CA mutations (47%). This suggests the upregulation of bile acid metabolites has a negative correlation with TP53. There is also evidence of no deregulation of six cancer hallmarks. This signifies the protective effects when bile acids are accumulated to improve the clinical outcome of patients with breast cancer (Iqbal et al., 2023; Tang et al., 2019).
The M2 intermediate subtype had 28% and 39% of TP53 and PIK3CA mutations respectively. The presence of the oncogenic PIK3CA forms a dependent mechanism of methionine in breast cancer (Lien et al. 2017). They have a negative correlation with the MTORC1 pathway and are associated with apoptosis, epithelial-mesenchymal transition, and angiogenesis hallmarks. This may also suggest why their M2 cell lines were more sensitive to methionine deprivation than M3 cells. Nevertheless, despite the negative correlation it had maximal sensitivity to rapamycin mTOR inhibitor (Iqbal et al., 2023). Arecaidine ester was the most effective inhibitor for M2 cell lines. T47D. There was also deregulated ethanol metabolism in M2 where it promotes proliferation of ER-positive M2-type cell lines like MCF7 and ZR75.
Other mutations GATA3, MAP3K1, and CDH1 had similar trends to PI3CKA. This highlights how the clinical parameters between the metabolic subtypes provide information on characteristics and patient outcomes. Nevertheless, the transcriptomics data in METABRIC lacked equal representation of all ethnicities and were largely European ancestry which limits the ethical considerations (Iqbal et al., 2023).
Copy Number Variation Data and stratification
Simultaneously, there were five genes uncovered by Iqbal et al., (2023). MYC, RSPO2, EIF3E, RAD21, and EXT1 were tested for the link with metabolic clusters and were applied to copy number variation (CNV) data for 1568 genes using the Kruskal-Wallis test. The 1568 cancer genes (OncoKB) had CNV in 10% or more samples were selected. The M3 subtype had a high amplification of CNV of genes that correlate with pyrimidine metabolism. On the other hand, M1 (bile acid metabolism) had the least amplification. M2 (methionine metabolism) was negatively correlated with gene amplification. The difference in copy number gains for all 5 genes was less in M2/M3 compared to M1/M3 and M1/M2. This relates to roles in metabolic deregulation and genomic alterations.
The presence of oncogenic MYC in CNV data coordinates with findings of its function in raising glucose uptake and the breakdown of glutamine. The production of lipogenesis and regulation of fatty acids is stimulated by glutamine. This highlights the dependence on glutamine in the augmentation of tumour growth, invasion, and survival (Wise et al. 2008). On the other hand, this is dependent on the tumour type where glutamate enrichment appears in cancer cells that have high levels of glutamine namely breast cancer. It also depends on the rate of nucleotides and amino acids (Zhou et al., 2012). Conversely, in vivo studies suggest some cancers like NSCLC, colorectal, and stomach cancer are less dependent on glutamine metabolism but more on glucose catabolism (Davidson et al., 2016). This may be associated with the increased rate of glutaminolysis that facilitates tumour proliferation (Hirayama et al., 2009). However, Manna et al. (2014) discovered glutamic acid alongside alternative metabolites related to methylation, nucleic acid metabolism, and polyamine metabolism were comparable to non-tumour tissues and were detectable in the urine of colorectal tumour-induced mice. These contrasting findings further suggest that genetic and metabolic heterogeneity in tumours interrelate and vary in metabolic dependencies and type of biofluid.
Gastric cancer and metabolomics
Early diagnosis of gastric cancer (GC) is crucial for improved clinical outcomes (Chen et al., 2024). Endoscopic examination is the gold standard method for diagnosis. However, endoscopy has encountered several challenges, such as the need for timely intervention, invasiveness, and cost, limiting its application (Koo et al., 2020). This demonstrates the dire need for disease management to improve prognostic surveillance. The empirical judgment of a surgeon determines the prognostic and predictive values to refine clinical parameters namely tumour site, staging of the tumour, and histopathological assessment which halts its accuracy (Chen et al. 2024; Ludwig and Weinstein, 2005). This indicates the presence of pathomics and methods to stratify patients into varied risk groups per intervention. (Chen et al., 2024).
Metabolic alterations caused by the net result of genetic and environmental sources upsurge gastric tumour growth and progression (Liu and Locasale, 2017). Exploratory evaluation of metabolomics in GC patients can systematically identify biomarkers and potential therapeutic targets (Adam et al., 2021). LC-MS targeted metabolomics analysed 702 subjects, GC (389), and controls (313) (Chen et al., 2024). A total of 147 metabolites were detected including amino acids, organic acids, nucleotides, nucleosides, vitamins, acylcarnitines, amines, and carbohydrates. Through the machine learning analysis, Chen et al. (2022) discovered 10 metabolite diagnostic models that were validated with an external set. It had a high sensitivity of 0.905. The three most contributing metabolites as part of the 10-DM model were lactate, succinate, and uridine (Chen et al. 2024). This is significantly higher than protein markers established via conventional methods and can be used to determine the degree of aggressiveness in cancer cells. Namely, Carbohydrate Antigen 19-9 (CA19-9), Cancer Antigen 72-4 (CA72-4), and Carcinoembryonic Antigen (CEA) with reported sensitivities of 0.217, 0.317, and 0.165 respectively. This may explain why all three markers are combined in clinical practice to raise the specificity. This is ca. 4.17-, 2.85-, and 5.49-fold difference correspondingly in comparison to the 10-DM model. Such performance was also validated when assessed against different machine-learning algorithms with the same successive outcome.
Similarly, a 28-prognostic model using the random survival forest method also superseded the sensitivity and robustness of other prognostic markers (Chen et al., 2024). He utilized 181 GC subjects that had a median follow-up of 40 months. They had a high concordance index (C-index) of 0.90 to improve clinical outcomes, particularly for the early stage with a C-index (0.868) in comparison to the late stage (0.778) (Chen et al., 2024). The C-index is a statistical measure of accuracy between the predicted and actual values.
39.2% of the 28 prognostic biomarkers (n=11) were distinguishable from the test set. Amongst the examples were symmetric dimethylarginine/asymmetric dimethylarginine (SDMA/ADMA). Both migration and invasion of GC cells escalated via regulating the expression of beta-catenin of the Wnt signalling pathway and the epithelial-mesenchymal transition (Guo et al., 2021). Another example of a beneficial metabolite is neopterin produced by the macrophages and dendritic cells. It is stimulated by interferon-gamma (IFN-γ) and signifies the activation of the immune response and a worse prognosis. This has been consistent with previous studies in monitoring the progress of alternative tumours: endometrial, gastric, prostate, and colorectal (Bostanci et al., 2017; Pichler et al., 2017; Nechita et al., 2023; Ciocan et al., 2023). This further illustrates how the ability of the artificial intelligence approach via machine learning thrived to share robust signatures of subtypes from metabolomics origin to help with precision intervention. There are subtype-specific sensitivities to different types of drugs.
Other metabolites and stratification
Successive outcomes in studying serum biomarkers where antigens and hormones aided in the diagnosis and prognosis of endocrine cancers (pancreatic ductal adenocarcinoma, thyroid, hepatocellular carcinoma) and gynaecological cancers (prostate adenocarcinoma, ovarian and non-seminomatous germ-cell tumours) (Schmidt et al., 2021).
The prospective analysis discovered that acylcarnitine and phosphatidylcholine increase the risk of breast cancer before cancer diagnosis. High levels of 14:0 carnitine and 8:0 carnitine were also found in gastric cancers and interpreted with worse prognosis (Chen et al., 2024). Higher levels of lysophosphatidylcholine decreased the risk of breast, colorectal, and prostate cancer (His et al., 2019; Kuhn et al., 2016). Metabolites related to alcohol, Vitamin E, and animal fat increase the incidence of hormone receptor-positive breast cancer (Playdon et al., 2017). These further results demonstrate the role of aberrant metabolism of different substrates in tumourigenesis and progression.
Moreover, the significant impact on understanding the importance of metabolomics and transcriptomics in stratified medicine and how it is a good principle to rationally select targeted therapy to correlate with metabolic dependencies in cancer. Alternatively, there are several challenges unrevealed: the use of gene expression and measuring metabolites do not strongly associate with metabolomic pathway flux. There is fluidity where gene expression subtypes are more stable than metabolomic subtypes. The use of cell lines for preclinical testing of drug sensitivity is not parallel between in vitro and in vivo studies despite in vitro being accessible and helping evaluate the efficacy of drugs (Iqbal et al., 2023). Combined omic data sets will further clinically validate drug targets rather than evaluate individual targets.
Radiological scans and its role in stratified medicine
Prospective techniques such as X-ray, computed tomography (CT), positron emission tomography (PET), and magnetic resonance imaging (MRI) do not require invasive procedures to obtain clinical samples. To observe the patient’s interior body, one examines what happens between electromagnetic radiations within the body. 2-(18F)-fluoro-2-deoxy-Dglucose (FDG), a PET-active glucose analogue that resides in malignant tumour tissues with enhanced metabolic rate, particularly glucose (Som et al., 1980). The application of PET scans is useful for diagnosing and examining therapeutic responses in many types of cancers. Notably, lymphomas, and differentiating between benign and malignant tumour tissues (Nguyen, Nguyen, and Nguyen, 2011). Other successive reports revealed that FDG uptake helps diagnose head and neck cancers, and pancreatic, lung, and unknown tumours. It also serves as a staging method to detect lymphoma, breast, colon, oesophageal, melanoma, and head and neck cancer. Recurrent tumours of the head and neck, thyroid, breast, colorectal, lymphoma, and thyroid carcinoma are also brought to light (Fletcher et al., 2008). This illustrates the multifunctional impact PET has on the clinical diagnosis of cancer.
A combination of PET/CT scans was first integrated in 1998 where CT further enhanced the resolution to define the location of lesions that could not be achieved via PET alone to help characterize cellular metabolism. This attenuates the correction of PET functional images and lowers the potential risk of false-negative and false-positive findings. It lasts for a duration of 20 to 30 minutes and there is ca. 30% faster response than PET with radioactive sources (Nguyen, Nguyen, and Nguyen, 2011).
There are alternative radiolabelled carbohydrates, fatty acids, and amino acids to be used in the diagnosis of tumours with high metabolic activity. For example, D-mannose, D-galactose, D-lactose, and D-fructose are F-labelled sugars that can detect pancreatic and breast cancer cells (Furomoto et al., 2013; Arumugam et al., 2014; Wuest et al., 2011). Amino-acid-derived tracers like [11C]-tyrosine and [11C]-methionine can evaluate pancreatic and brain tumours respectively (Van den Bergh et al., 2011; Bustany et al., 1986). Radiolabelled forms of choline found in the phospholipid namely [18F]-fluoromethylcholine and [18F]-fluoroethylcholine can help detect prostate cancer (DeGrado et al., 2011). This implies that the type of radiotracer is dependent on the biochemical source or substrate in how the cancer obtains energy.
The classification of metabolic PET parameters to provide a visual assessment of FDG uptake determines therapeutic and metabolic response at intervals at the end of therapy (EoT) and interim period (Cheson et al., 2014). It is important to distinguish what occurs during the initial treatment stages during the interim period in a lymphoma patient as presented in Figure 7. At first, the recruitment of immune cells into the tumour microenvironment results in the enlargement of the tumour size and metabolic activity (Lopci and Meignan, 2020). In the follow-up images, delayed immunological response, tumour regression, and other clinical outcomes present pseudoprogression (Al Ibraheem et al., 2023). Pseudoprogression is further confirmed by the pathological assessment of enlarged lesions in the biopsy specimen (Tanizaki et al., 2016). This emphasizes how some cancer patients may appear to have disease progression until they achieve favourable clinical outcomes.
On the other hand, hyper progression is characterized in 29% of patients treated with immunotherapy and commonly affects elderly patients. The enhanced tumour growth is associated with poor prognosis and deterioration of the patient’s health. The abscopal effect of radiotherapy and immunotherapy synergistically mediated positive clinical responses in immunocompetent patients particularly those with metastatic solid tumours (Kang. Demaria and Formenti, 2016; Golden et al., 2015).
After four cycles of immunotherapy, Pembrolizumab, the Deaville Score (DS) was 5 – please see Figure 7. The DS is the international standard for reporting FDG uptake in treatment for lymphoma patients. It compares the uptake of the liver with the mediastinum (Pocket Health, 2025). The mediastinum is a space between the lungs and entails the heart, oesophagus, large blood vessels, and trachea. A value of 5 indicates there is an increase in FDG uptake compared to the liver and is considered inadequate (Al-Ibraheem et al., 2023).
There is a significant visual difference in the second PET/CT image from the baseline scan in Figure 7 where more of the organ structures are intensified suggesting higher FDG uptake. This is particularly notable in the spleen, brain, liver, and kidneys because they have higher glucose demand and normal uptake that corresponds to standardized metabolic parameters (Al-Ibraheem et al., 2022).
However, increased FDG uptake may also suggest cancer because of the metabolic activity. Residual lymphomatous lesions are identified in intensified areas during the interim period (iPET) (Al-Ibraheem et al., 2022). Furthermore, the two-fold difference in overall tumour burden when comparing baseline imaging with initial immunotherapy would possibly lead to the termination of immunotherapy in such cases (Saada-Bouzid et al., 2017; Champiat et al., 2017). However, some tumours may naturally exhibit low FDG uptake (Pocket Health, 2025).
Another valid explanation for the score of 5 on the five Deauville 5-point scale in comparison to the baseline study may indicate partial medical response (PMR) (Al-Ibraheem et al., 2023). A sign of tissue healing following surgery, injury, radiotherapy, and in this case, immunotherapy (Pocket Health, 2025). The intensification of FDG could also be due to the presence of non-benign conditions where there are non-cancerous growths and active thyroid nodules. There is also a likelihood that it may present active inflammation at the site.
The third image in Figure 7 presents the DS value 1 which may suggest a complete metabolic response. This is commonly designated between values one – and three of the Deaville 5-point scale (5PS). This is better considering there is no FDG uptake in some areas or has been lessened (Pocket Health, 2025).
A tissue would be considered normal and healthy if there is low metabolic activity or no FDG uptake. In other patients could signify abnormalities and is medically decided based on the tissue type, overall health status, and comparing it with the baseline. For example, if the tumour is not actively growing, this could indicate that the previous areas that had tumour growth are no longer metabolically active because following treatment, the tumour tissue is undergoing necrosis but this is confirmed with additional testing. It could also imply no infection at the site or the cancer is metabolically inactive hence no FDG uptake. Minimally low or no uptake may be due to the presence of fat.
Other suggestions could be due to systematic errors or the scanning machine is not sensitive where the detection of FDG may not succeed (Pocket Health, 2025). This is further discussed in the subsequent section of this modest article.
Overall, it indicates the effectiveness of the Lugano criteria as a gold standard method in clinical trials of immunotherapy drugs that can be adopted in the haemato-oncology, radiology, and nuclear medicine disciplines to be compared with reference metabolic values derived from the blood pool of the mediastinum and the liver (Al-Ibraheem et al., 2023; Skusa et al., 2020).
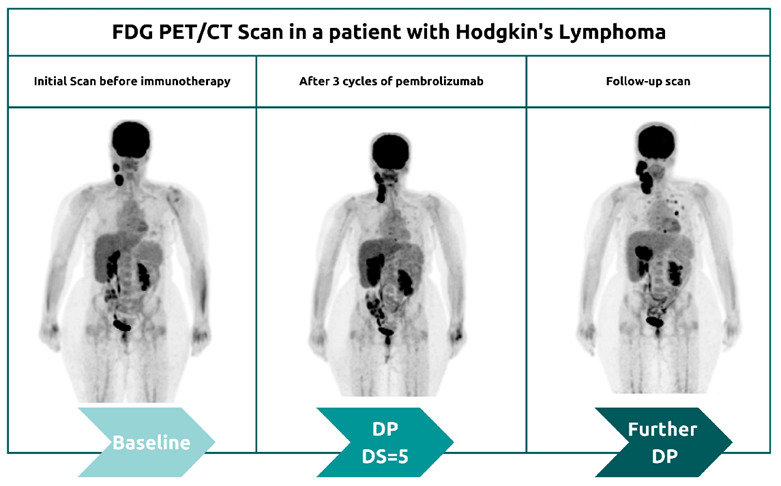
Figure 7: Coronal image of the first half of the body of a patient with Hodgkin’s lymphoma. The serial maximum intensity projection (MIP) presents pseudoprogression patterns for a short period. The Deauville Score (DS) is 5 emphasizing increased uptake compared to the liver.
Limitations of PET/CT in stratified analysis and solutions
The assessment of global metabolic alterations in biofluids can cause difficulty in differentiating between cancers. This confounding variable is overcome by the metabolic analysis of tumour tissue, to monitor early treatment and disease progression (Nguyen, Nguyen, and Nguyen, 2011). Nevertheless, every technique has several technical limitations and, in this case, PET is dependent on the target-to-background ratio (TBR).
The PET scan can potentially yield false-negative results due to the decreased absorption of FDG if there is a small tumour lesion such as ampullary carcinoma or has a low metabolic activity like neuroendocrine tumours, mucinous adenocarcinomas and carcinomas with signet-ring cells (Delbeke and Martin, 2010). Cancers that have undergone treatment and there is a presence of necrotic tissue can also decrease FDG absorption. This indicates how there is low detectability of primary tumours with histological types (Pang et al., 2020).
Pancreatic inflammatory disorders can stimulate the production of neoplasms and mimic malignancies: acute pancreatitis and autoimmune pancreatitis which can be induced by diabetic medicines. In some cases, patients with pancreatic pathological conditions with hyperglycaemia can competitively inhibit causing a decrease in FDG uptake (Nguyen, Nguyen, and Nguyen, 2011). To improve the detection of pancreatic cancer and resolve such limitations, the emergence of radiotracers 18(F)-fluoro-L-thymidine can help identify tumours where there is a high proliferation rate. Another tracer evaluated is 68Ga-labelled somatostatin analogues which have proved valuable in detecting neuroendocrine tumours with high affinity (Nguyen, Nguyen, and Nguyen, 2011).
Furthermore, not all metastases have high sensitivity for 18F-FDG PET. Pang et al. (2020) revealed that liver metastases and peritoneal carcinomatosis commonly found in patients with gastrointestinal cancer have low detectability. This contradicts the relation of high 18F-FDG, which is directly proportional to organs with high metabolic activity.
Moreover, misinterpretation may arise in technical faults like misregistration, the short half-life of several radiotracers, attenuation, poor resolution, and motion artifacts in imaging modalities. A non-invasive tool like MR spectral imaging (MRSI) can help develop new metabolic biomarkers. This is a valuable tool in patients with IDH-mutant glioma to detect 2-hydroxyglutarate and monitor IDH-targeted therapy (Andronesi et al., 2013; Choi et al., 2012). Isocitrate Dehydrogenase (IDH) is a metabolic enzyme that functions in the Krebs cycle. The Krebs cycle creates energy from the three-carbon molecules, pyruvate, produced in glycolysis. Pyruvate is converted into acetyl coA where one molecule of carbon dioxide and the electron carrier, NADH synthesized. They carry energy to the electron transport change to produce more energy in the form of adenosine triphosphate (ATP). ATP is the energy source that helps activate enzymes, transport proteins, and other cellular reactions (Buckley, 2021). IDH mutations can arise in glioblastomas because of hypermethylation and appear in ca. 10% of gliomas with astrocytoma origin (WHO Class II). Most IDH mutations have a point mutation where a substitution in the amino acid at point 132 from arginine to histidine occurs. This creates an immunosuppressive environment where T cells are unable to function (Zelba et al., 2025).
Nuvrozov et al. (2022) discovered a novel class of radiotracers, Fibroblast activation-protein-(FAP)-ligands like [68Ga]FAPI Gallium 68 (68Ga)-labelled fibroblast-activation protein inhibitor (FAPI) in patients with bladder cancer can help to clear delineation of primary tumours and produces low background signal. Retrospective analysis of a small cohort study of 8 patients with a median age of 66 who underwent PET/CT scanners with two types of radiotracers: [68Ga] FAPI and [18F] FDG with a median time interval of 5 days (range 1-20 days). The CT/PET images with [68Ga] FAPI elucidated its effect by detecting 31 metastases in five patients that were predominantly in the lymph node (n=23) and to a lesser effect the peritoneum (n=1). Minimal metastases were found in the bone (n=4) and lung (n=3). One patient had [68Ga] FAPI uptake near the bladder wall (Nuvrozov et al., 2022).
Additional results discovered there is a higher uptake and [68Ga] FAPI was able to diagnose 30% more lesions (n=9) that were undetectable in [18F] FDG. The uptake of the radiotracers was quantified by maximum standardized uptake value (SUVmax) and target-to-background ratio (TBR) (Wang et al., 2022). [68Ga] FAPI had a higher SUVmax than [18F] FDG. The SUV determines how much metabolic activity or FDG uptake is presented in the PET scan. In contrast, TBR measures the specificity of the uptake within the target organ (Jones, 2020). If there is a background signal in the external tissues other than the target organ, this may be secondary to a low retention rate where there is a leak into surrounding tissues or there is a preferential uptake of the radiotracer in the vascular structures due to metabolic activity, liver, spleen, gut, and kidneys (Jones, 2020).
The outperformance of [68Ga] FAPI was also mirrored in patients with lung, colorectal and gastric cancer where positive lesions were detected in a larger cohort study – please see Figure 8 (Wang et al., 2022; Pang et al., 2020). Wang et al., (2022) discovered more metastatic lesions when the uptake with [68Ga] FAPI than [18F] FDG in lung cancer patients: there were 356 lymph nodes detected via [68Ga] FAPI than 320 via [18F] FDG. A significant difference in detection was also observed in the brain (23 vs 10), bone (109 vs 91), and pleura (66 vs 35). The mean TBR was higher with 68Ga-FAPI (314.4) than with 18F-FDG (1.0) in lung cancer patients. There was no significant difference demonstrated in the SUVmax value in brain metastases in 68Ga-FAPI (9.0) than 18F-FDG (7.4) in lung cancer patients. However, there was a higher SUVmax value in bladder cancer patients where via 68Ga] FAPI it was 8.2 in comparison to [18F] FDG with 4.6 (Nuvrozov et al., 2022). This demonstrates the potentially favourable outcomes of 68Ga] FAPI than [18F] FDG to increase the accuracy in detecting tumour lesions.
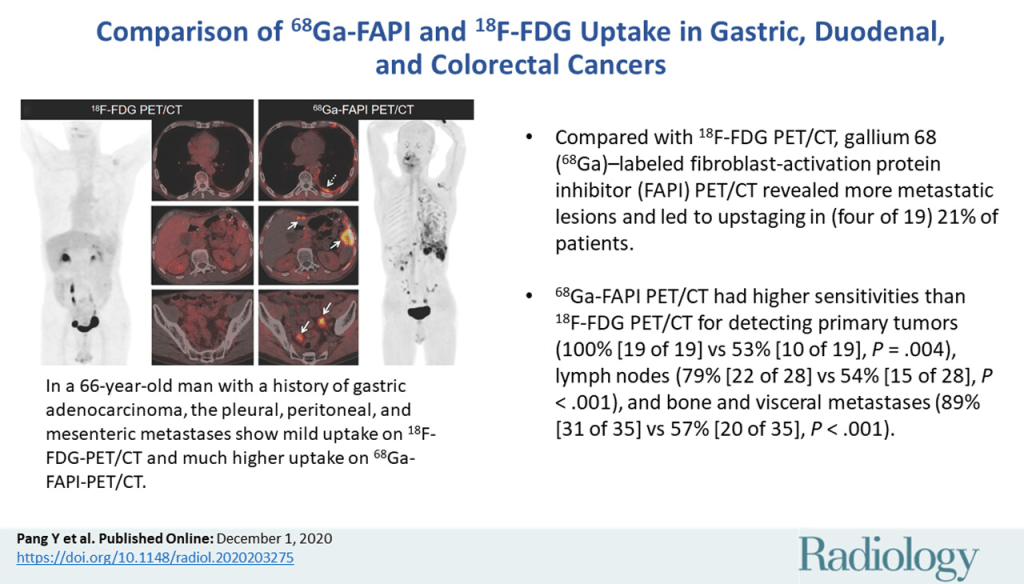
In conclusion, a single mutation grows through clonal expansion with additional mutations to achieve an invasive and metastatic potential. The introduction of omic technologies and microarray can identify potential biomarkers that have significant roles in predicting and diagnosing cancer early. It can also help monitor therapeutic responses using in vivo rodent tissues induced with cancer and biofluids to increase specificity and sensitivity. The energy dependence mechanisms depend on the substrate catabolized to fuel the high mitotic index and proliferation rate of tumours observed in in vitro and in vivo studies. Simultaneously, the clinical use of 68Ga-FAPI PET/CT improved imaging methodologies, helping to identify both primary and metastatic lesions that upstaged the Tumour, Necrosis, Metastasis (TNM) status, and oncological management of patients.
References
Andronesi, O.C., Rapalino, O., Gerstner, E., Chi, A., Batchelor, T.T., Cahill, D.P., Sorensen, A.G., and Rosen, B.R. (2013). Detection of oncogenic IDH1 mutations using magnetic resonance spectroscopy of 2-hydroxyglutarate. Journal of Clinical Investigation, 123(9), pp.3659–3663. doi:https://doi.org/10.1172/jci67229.
Arumugam, T., Paolillo, V., Young, D., Wen, X., Logsdon, C.D., De Palatis, L. and Alauddin, M.M. (2014). Preliminary evaluation of 1′-[18F]fluoroethyl-β-D-lactose ([18F]FEL) for detection of pancreatic cancer in nude mouse orthotopic xenografts. Nuclear Medicine and Biology, 41(10), pp.833–840. doi:https://doi.org/10.1016/j.nucmedbio.2014.08.001.
Cori, C.F. and Cori, G.T. (1925). THE CARBOHYDRATE METABOLISM OF TUMORS. Journal of Biological Chemistry, 65(2), pp.397–405. doi:https://doi.org/10.1016/s0021-9258(18)84849-9.
Düvel, K., Yecies, J.L., Menon, S., Raman, P., Lipovsky, A.I., Souza, A.L., Triantafellow, E., Ma, Q., Gorski, R., Cleaver, S., Vander Heiden, M.G., MacKeigan, J.P., Finan, P.M., Clish, C.B., Murphy, L.O. and Manning, B.D. (2010). Activation of a Metabolic Gene Regulatory Network Downstream of mTOR Complex 1. Molecular Cell, 39(2), pp.171–183. doi:https://doi.org/10.1016/j.molcel.2010.06.022.
Guo, Q., Xu, J., Huang, Z., Yao, Q., Chen, F., Liu, H., Zhang, Z. and Lin, J. (2020). ADMA mediates gastric cancer cell migration and invasion via Wnt/β-catenin signaling pathway. Clinical and Translational Oncology, 23(2), pp.325–334. doi:https://doi.org/10.1007/s12094-020-02422-7.
Kühn, T., Floegel, A., Sookthai, D., Johnson, T., Rolle-Kampczyk, U., Otto, W., von Bergen, M., Boeing, H. and Kaaks, R. (2016). Higher plasma levels of lysophosphatidylcholine 18:0 are related to a lower risk of common cancers in a prospective metabolomics study. BMC medicine, [online] 14, p.13. doi:https://doi.org/10.1186/s12916-016-0552-3.
Mullen, G.E. and Yet, L. (2015). ChemInform Abstract: Progress in the Development of Fatty Acid Synthase Inhibitors as Anticancer Targets. ChemInform, 46(48). doi:https://doi.org/10.1002/chin.201548255.
Rose, G., Blackburn, H., Keys, A., Taylor, H.L., Kannel, W.B., Paul, O., Reid, D.D. and Stamler, J. (1974). Colon Cancer And Blood-Cholesterol. The Lancet, 303(7850), pp.181–183. doi:https://doi.org/10.1016/s0140-6736(74)92492-1.
Rubin, M.A. (2002). α-Methylacyl Coenzyme A Racemase as a Tissue Biomarker for Prostate Cancer. JAMA, 287(13), p.1662. doi:https://doi.org/10.1001/jama.287.13.1662.
Salama, M. and Khairy, D. (2021). Polo-Like Kinase 1(PLK1) Immunohistochemical Expression in Triple Negative Breast Carcinoma: A Probable Therapeutic Target. Asian Pacific Journal of Cancer Prevention, 22(12), pp.3921–3925. doi:https://doi.org/10.31557/apjcp.2021.22.12.3921.
Vander Heiden, M.G. and DeBerardinis, R.J. (2017). Understanding the Intersections between Metabolism and Cancer Biology. Cell, 168(4), pp.657–669. doi:https://doi.org/10.1016/j.cell.2016.12.039.
Wuest, M., Trayner, B.J., Grant, T.N., Jans, H.-S., Mercer, J.R., Murray, D., West, F.G., McEwan, A.J.B., Wuest, F. and Cheeseman, C.I. (2011). Radiopharmacological evaluation of 6-deoxy-6-[18F]fluoro-d-fructose as a radiotracer for PET imaging of GLUT5 in breast cancer. Nuclear Medicine and Biology, 38(4), pp.461–475. doi:https://doi.org/10.1016/j.nucmedbio.2010.11.004.
Ackerman, D. and Simon, M.C. (2014). Hypoxia, lipids, and cancer: surviving the harsh tumor microenvironment. Trends in Cell Biology, 24(8), pp.472–478. doi:https://doi.org/10.1016/j.tcb.2014.06.001.
Al-Ibraheem, A., Abdlkadir, A.S., Juweid, M.E., Al-Rabi, K., Ma’koseh, M., Abdel-Razeq, H. and Mansour, A. (2023). FDG-PET/CT in the Monitoring of Lymphoma Immunotherapy Response: Current Status and Future Prospects. Cancers, [online] 15(4), p.1063. doi:https://doi.org/10.3390/cancers15041063.
Al-Ibraheem, A., Anwer, F., Juweid, M.E., Shagera, Q.A., Khalaf, A.N., Obeidat, S., Mansour, A., Ma’koseh, M., Halahleh, K., Jaradat, I., Almasri, N. and Mansour, A. (2022). Interim FDG-PET/CT for therapy monitoring and prognostication in Hodgkin’s Lymphoma. Scientific Reports, 12(1). doi:https://doi.org/10.1038/s41598-022-22032-3.
Alizadeh, A.A., Eisen, M.B., Davis, R.E., Ma, C., Lossos, I.S., Rosenwald, A., Boldrick, J.C., Sabet, H., Tran, T., Yu, X., Powell, J.I., Yang, L., Marti, G.E., Moore, T., Hudson, J., Lu, L., Lewis, D.B., Tibshirani, R., Sherlock, G. and Chan, W.C. (2000). Distinct types of diffuse large B-cell lymphoma identified by gene expression profiling. Nature, 403(6769), pp.503–511. doi:https://doi.org/10.1038/35000501.
Alomari, O.A., Khader, A.T., Al-betar, M.A., & Abualigah, L.M. (2017). Mrmr Ba : A Hybrid Gene Selection Algorithm For Cancer Classification. Journal of Theoretical and Applied Information Technology, 95 (12), p. 15
Bell, J. (2014). Stratified medicines: towards better treatment for disease. The Lancet, 383, pp.S3–S5. doi:https://doi.org/10.1016/s0140-6736(14)60115-x.
Bennet, J., Chilambuchelvan Ganaprakasam and Kumar, N. (2015). A Hybrid Approach for Gene Selection and Classification using Support Vector Machine. The International Arab Journal of Information Technology, 12, pp.695–700.
Bostanci, E.I., Asiye Ugras Dikmen, A.U., Girgin, G., Gungor, T., Baydar, T. and Danisman, A.N. (2017). A New Diagnostic and Prognostic Marker in Endometrial Cancer: Neopterin. International Journal of Gynecological Cancer, 27(4), pp.754–758. doi:https://doi.org/10.1097/igc.0000000000000952.
Brar, G. (2025) Non-Small Cell Lung Cancer Treatment (PDQ®)–Patient Version. Available at: https://www.verywellhealth.com/non-small-cell-lung-cancer-4153003 (Accessed: 30th May 2025)
Broadhurst, D., Goodacre, R., Reinke, S.N., Kuligowski, J., Wilson, I.D., Lewis, M.R. and Dunn, W.B. (2018). Guidelines and considerations for the use of system suitability and quality control samples in mass spectrometry assays applied in untargeted clinical metabolomic studies. Metabolomics, [online] 14(6). doi:https://doi.org/10.1007/s11306-018-1367-3.
Buckley, G. (2021) Krebs Cycle. Available at: https://biologydictionary.net/krebs-cycle/#google_vignette (Accessed: 11th June 2025)
Bustany, P., Chatel, M., Derlon, J.M., Darcel, F., Sgouropoulos, P., Soussaline, F. and Syrota, A. (1986). Brain tumor protein synthesis and histological grades: A study by positron emission tomography (PET) with C11-L-Methionine. Journal of Neuro-Oncology, 3(4), pp.397–404. doi:https://doi.org/10.1007/bf00165590.
Cancer Research UK (2022) Types of lung cancer. Available at: https://www.cancerresearchuk.org/about-cancer/lung-cancer/stages-types-grades/types (Accessed: 30th May 2025)
Carter, J. and Tadi, P. (2024) Erlotinib. Available at: https://www.ncbi.nlm.nih.gov/books/NBK554484/ (Accessed: 31st May 2025)
Cerone, M.A., Mills, T.C., Sharpe, R., McBride, D., MacDonald, M., MacMahon, S., Mugalaasi, H., Rehal, P., Rettino, A., Roberts, H., Ross, M., White, D.E., Peden, J., Rawlinson, J., Ho, S.N., Hollingsworth, S., Popat, S., Middleton, G., Johnson, P. and Swanton, C. (2023). The Cancer Research UK Stratified Medicine Programme as a model for delivering personalised cancer care. British Journal of Cancer, [online] 128(2), pp.161–164. doi:https://doi.org/10.1038/s41416-022-02107-8.
Champiat, S., Dercle, L., Ammari, S., Massard, C., Hollebecque, A., Postel-Vinay, S., Chaput, N., Eggermont, A., Marabelle, A., Soria, J.-C. and Ferté, C. (2017). Hyperprogressive Disease Is a New Pattern of Progression in Cancer Patients Treated by Anti-PD-1/PD-L1. Clinical cancer research : an official journal of the American Association for Cancer Research, [online] 23(8), pp.1920–1928. doi:https://doi.org/10.1158/1078-0432.CCR-16-1741.
Chapman, P.B., Hauschild, A., Robert, C., Haanen, J.B., Ascierto, P., Larkin, J., Dummer, R., Garbe, C., Testori, A., Maio, M., Hogg, D., Lorigan, P., Lebbe, C., Jouary, T., Schadendorf, D., Ribas, A., O’Day, S.J., Sosman, J.A., Kirkwood, J.M. and Eggermont, A.M.M. (2011). Improved survival with vemurafenib in melanoma with BRAF V600E mutation. The New England journal of medicine, 364(26), pp.2507–16. doi:https://doi.org/10.1056/NEJMoa1103782.
Chen, D., Fu, M., Chi, L., Lin, L., Cheng, J., Xue, W., Long, C., Jiang, W., Dong, X., Sui, J., Lin, D., Lu, J., Zhuo, S., Liu, S., Li, G., Chen, G. and Yan, J. (2022). Prognostic and predictive value of a pathomics signature in gastric cancer. Nature Communications, 13(1). doi:https://doi.org/10.1038/s41467-022-34703-w.
Chen, Y., Wang, B., Zhao, Y., Shao, X., Wang, M., Ma, F., Yang, L., Nie, M., Jin, P., Yao, K., Song, H., Lou, S., Wang, H., Yang, T., Tian, Y., Han, P. and Hu, Z. (2024). Metabolomic machine learning predictor for diagnosis and prognosis of gastric cancer. Nature Communications, [online] 15(1). doi:https://doi.org/10.1038/s41467-024-46043-y.
Cheson, B.D., Fisher, R.I., Barrington, S.F., Cavalli, F., Schwartz, L.H., Zucca, E. and Lister, T.A. (2014). Recommendations for Initial Evaluation, Staging, and Response Assessment of Hodgkin and Non-Hodgkin Lymphoma: The Lugano Classification. Journal of Clinical Oncology, 32(27), pp.3059–3067. doi:https://doi.org/10.1200/jco.2013.54.8800.
Choi, C., Ganji, S.K., DeBerardinis, R.J., Hatanpaa, K.J., Rakheja, D., Kovacs, Z., Yang, X.-L., Mashimo, T., Raisanen, J.M., Marin-Valencia, I., Pascual, J.M., Madden, C.J., Mickey, B.E., Malloy, C.R., Bachoo, R.M. and Maher, E.A. (2012). 2-hydroxyglutarate detection by magnetic resonance spectroscopy in IDH-mutated patients with gliomas. Nature Medicine, 18(4), pp.624–629. doi:https://doi.org/10.1038/nm.2682.
Ciocan, A., Ciocan, R.A., Nadim Al Hajjar, Benea, A.M., Pandrea, S.L., Cătană, C.S., Drugan, C., Oprea, V.C., Dîrzu, D.S. and Bolboacă, S.D. (2023). Exploratory Evaluation of Neopterin and Chitotriosidase as Potential Circulating Biomarkers for Colorectal Cancer. Biomedicines, 11(3), pp.894–894. doi:https://doi.org/10.3390/biomedicines11030894.
Corcoran, R.B., Hiromichi Ebi, Turke, A.B., Coffee, E.M., Nishino, M., Cogdill, A.P., Brown, R.D., Dias-Santagata, D., Pelle, P.D., Hung, K.E., Flaherty, K.T., Adriano Piris, Wargo, J.A., Settleman, J., Mino-Kenudson, M. and Engelman, J.A. (2012). Abstract LB-350: EGFR-mediated re-activation of MAPK signaling contributes to insensitivity of BRAF mutant colorectal cancers to RAF inhibition by vemurafenib. Cancer Research, 72(8_Supplement), p.LB-350. doi:https://doi.org/10.1158/1538-7445.am2012-lb-350.
Corless, C.L., Barnett, C.M. and Heinrich, M.C. (2011). Gastrointestinal stromal tumours: origin and molecular oncology. Nature Reviews Cancer, 11(12), pp.865–878. doi:https://doi.org/10.1038/nrc3143.
Curtin, J.A., Fridlyand, J., Kageshita, T., Patel, H.N., Busam, K.J., Kutzner, H., Cho, K.-H., Aiba, S., Bröcker, E.-B., LeBoit, P.E., Pinkel, D. and Bastian, B.C. (2005). Distinct Sets of Genetic Alterations in Melanoma. New England Journal of Medicine, [online] 353(20), pp.2135–2147. doi:https://doi.org/10.1056/nejmoa050092.
Davidson, S.M., Papagiannakopoulos, T., Olenchock, B.A., Heyman, J.E., Keibler, M.A., Luengo, A., Bauer, M.R., Jha, A.K., O’Brien, J.P., Pierce, K.A., Gui, D.Y., Sullivan, L.B., Wasylenko, T.M., Subbaraj, L., Chin, C.R., Stephanopolous, G., Mott, B.T., Jacks, T., Clish, C.B. and Vander Heiden, M.G. (2016). Environment Impacts the Metabolic Dependencies of Ras-Driven Non-Small Cell Lung Cancer. Cell Metabolism, [online] 23(3), pp.517–528. doi:https://doi.org/10.1016/j.cmet.2016.01.007.
Davies, H., Bignell, G.R., Cox, C., Stephens, P., Edkins, S., Clegg, S., Teague, J., Woffendin, H., Garnett, M.J., Bottomley, W., Davis, N., Dicks, E., Ewing, R., Floyd, Y., Gray, K., Hall, S., Hawes, R., Hughes, J., Kosmidou, V. and Menzies, A. (2002). Mutations of the BRAF gene in human cancer. Nature, 417(6892), pp.949–954. doi:https://doi.org/10.1038/nature00766.
DeGrado, T.R., Coleman, R.E., Wang, S., Baldwin, S.W., Orr, M.D., Robertson, C.N., Polascik, T.J. and Price, D.T. (2001). Synthesis and evaluation of 18F-labeled choline as an oncologic tracer for positron emission tomography: initial findings in prostate cancer. PubMed, 61(1), pp.110–7.
Delbeke, D. and Martin, W.H. (2010). PET and PET/CT for Pancreatic Malignancies. Surgical Oncology Clinics of North America, 19(2), pp.235–254. doi:https://doi.org/10.1016/j.soc.2009.11.005.
Demicco, M., Liu, X.-Z., Leithner, K. and Fendt, S.-M. (2024). Metabolic heterogeneity in cancer. Nature Metabolism, 6(1), pp.18–38. doi:https://doi.org/10.1038/s42255-023-00963-z.
Denko, N.C. (2008). Hypoxia, HIF1 and glucose metabolism in the solid tumour. Nature Reviews Cancer, 8(9), pp.705–713. doi:https://doi.org/10.1038/nrc2468.
Dey, N., Crosswell, H.E., De, P., Parsons, R., Peng, Q., Su, J.D. and Durden, D.L. (2008). The Protein Phosphatase Activity of PTEN Regulates Src Family Kinases and Controls Glioma Migration. Cancer Research, 68(6), pp.1862–1871. doi:https://doi.org/10.1158/0008-5472.can-07-1182.
Elia, I. and Haigis, M.C. (2021). Metabolites and the tumour microenvironment: from cellular mechanisms to systemic metabolism. Nature Metabolism, [online] 3(1), pp.21–32. doi:https://doi.org/10.1038/s42255-020-00317-z.
Elstrom, R.L., Bauer, D.E., Buzzai, M., Karnauskas, R., Harris, M.H., Plas, D.R., Zhuang, H., Cinalli, R.M., Alavi, A., Rudin, C.M. and Thompson, C.B. (2004). Akt Stimulates Aerobic Glycolysis in Cancer Cells. Cancer Research, 64(11), pp.3892–3899. doi:https://doi.org/10.1158/0008-5472.can-03-2904.
Fletcher, J.W., Djulbegovic, B., Soares, H.P., Siegel, B.A., Lowe, V.J., Lyman, G.H., Coleman, R.E., Wahl, R., Paschold, J.C., Avril, N., Einhorn, L.H., Suh, W.W., Samson, D., Delbeke, D., Gorman, M. and Shields, A.F. (2008). Recommendations on the Use of 18F-FDG PET in Oncology. Journal of Nuclear Medicine, 49(3), pp.480–508. doi:https://doi.org/10.2967/jnumed.107.047787.
Freidlin, B., McShane, L.M. and Korn, E.L. (2010). Randomized Clinical Trials With Biomarkers: Design Issues. JNCI Journal of the National Cancer Institute, [online] 102(3), pp.152–160. doi:https://doi.org/10.1093/jnci/djp477.
Furumoto, S., Shinbo, R., Iwata, R., Ishikawa, Y., Yanai, K., Yoshioka, T. and Fukuda, H. (2013). In vitro and in vivo characterization of 2-deoxy-2-18F-fluoro-D-mannose as a tumor-imaging agent for PET. Journal of Nuclear Medicine: Official Publication, Society of Nuclear Medicine, [online] 54(8), pp.1354–1361. doi:https://doi.org/10.2967/jnumed.112.113571.
Fusté, N.P., Fernández-Hernández, R., Cemeli, T., Mirantes, C., Pedraza, N., Rafel, M., Torres-Rosell, J., Colomina, N., Ferrezuelo, F., Dolcet, X. and Garí, E. (2016). Cytoplasmic cyclin D1 regulates cell invasion and metastasis through the phosphorylation of paxillin. Nature Communications, 7(1). doi:https://doi.org/10.1038/ncomms11581.
Glinsky, G.V., Berezovska, O. and Glinskii, A.B. (2005). Microarray analysis identifies a death-from-cancer signature predicting therapy failure in patients with multiple types of cancer. Journal of Clinical Investigation, 115(6), pp.1503–1521. doi:https://doi.org/10.1172/jci23412.
Golden, E.B., Chhabra, A., Chachoua, A., Adams, S., Donach, M., Fenton-Kerimian, M., Friedman, K., Ponzo, F., Babb, J.S., Goldberg, J., Demaria, S. and Formenti, S.C. (2015). Local radiotherapy and granulocyte-macrophage colony-stimulating factor to generate abscopal responses in patients with metastatic solid tumours: a proof-of-principle trial. The Lancet Oncology, 16(7), pp.795–803. doi:https://doi.org/10.1016/s1470-2045(15)00054-6.
Golub, T.R., Slonim, D.K., Tamayo, P., Huard, C., Gaasenbeek, M., Mesirov, J.P., Coller, H., Loh, M.L., Downing, J.R., Caligiuri, M.A., Bloomfield, C.D. and Lander, E.S. (1999). Molecular Classification of Cancer: Class Discovery and Class Prediction by Gene Expression Monitoring. Science, 286(5439), pp.531–537. doi:https://doi.org/10.1126/science.286.5439.531.
Gong, X., Litchfield, L.M., Webster, Y., Chio, L.-C., Wong, S.S., Stewart, T.R., Dowless, M., Dempsey, J., Zeng, Y., Torres, R., Boehnke, K., Mur, C., Marugán, C., Baquero, C., Yu, C., Bray, S.M., Wulur, I.H., Bi, C., Chu, S. and Qian, H.-R. (2017). Genomic Aberrations that Activate D-type Cyclins Are Associated with Enhanced Sensitivity to the CDK4 and CDK6 Inhibitor Abemaciclib. Cancer Cell, [online] 32(6), pp.761-776.e6. doi:https://doi.org/10.1016/j.ccell.2017.11.006.
Hambali, M.A., Oladele, T.O. and Adewole, K.S. (2020). Microarray cancer feature selection: Review, challenges and research directions. International Journal of Cognitive Computing in Engineering, 1, pp.78–97. doi:https://doi.org/10.1016/j.ijcce.2020.11.001.
Harbers, L., Agostini, F., Nicos, M., Poddighe, D., Bienko, M. and Crosetto, N. (2021). Somatic Copy Number Alterations in Human Cancers: An Analysis of Publicly Available Data From The Cancer Genome Atlas. Frontiers in Oncology, [online] 11, p.700568. doi:https://doi.org/10.3389/fonc.2021.700568.
Harvei, S., Bjerve, K.S., Tretli, S., Jellum, E., Robsahm, T.E. and Vatten, L. (1997). Prediagnostic level of fatty acids in serum phospholipids: Ω-3 and Ω-6 fatty acids and the risk of prostate cancer. International Journal of Cancer, 71(4), pp.545–551. doi:https://doi.org/10.1002/(sici)1097-0215(19970516)71:4%3C545::aid-ijc7%3E3.0.co;2-u.
Hauschild, A., Grob, J.-J., Demidov, L.V., Jouary, T., Gutzmer, R., Millward, M., Rutkowski, P., Blank, C.U., Miller, W.H., Kaempgen, E., Martín-Algarra, S., Karaszewska, B., Mauch, C., Chiarion-Sileni, V., Martin, A.-M., Swann, S., Haney, P., Mirakhur, B., Guckert, M.E. and Goodman, V. (2012). Dabrafenib in BRAF-mutated metastatic melanoma: a multicentre, open-label, phase 3 randomised controlled trial. The Lancet, 380(9839), pp.358–365. doi:https://doi.org/10.1016/s0140-6736(12)60868-x.
Hirayama, A., Kami, K., Sugimoto, M., Sugawara, M., Toki, N., Onozuka, H., Kinoshita, T., Saito, N., Ochiai, A., Tomita, M., Esumi, H. and Soga, T. (2009). Quantitative Metabolome Profiling of Colon and Stomach Cancer Microenvironment by Capillary Electrophoresis Time-of-Flight Mass Spectrometry. Cancer Research, [online] 69(11), pp.4918–4925. doi:https://doi.org/10.1158/0008-5472.can-08-4806.
His, M., Viallon, V., Dossus, L., Gicquiau, A., Achaintre, D., Scalbert, A., Ferrari, P., Romieu, I., Onland-Moret, N.C., Weiderpass, E., Dahm, C.C., Overvad, K., Olsen, A., Tjønneland, A., Fournier, A., Rothwell, J.A., Severi, G., Kühn, T., Fortner, R.T. and Boeing, H. (2019). Prospective analysis of circulating metabolites and breast cancer in EPIC. BMC Medicine, 17(1). doi:https://doi.org/10.1186/s12916-019-1408-4.
Hopkins, B.D., Hodakoski, C., Barrows, D., Mense, S.M. and Parsons, R.E. (2014). PTEN function: the long and the short of it. Trends in Biochemical Sciences, 39(4), pp.183–190. doi:https://doi.org/10.1016/j.tibs.2014.02.006.
Illumina (2025) Introduction to Next Generation Sequencing. Available at: https://www.illumina.com/science/technology/next-generation-sequencing.html (Accessed: 3rd June 2025)
Iqbal, M.A, Siddiqui, S., Smith, K., Singh, P., Kumar, B., Salem Chouaib and Chandrasekaran, S. (2023). Metabolic stratification of human breast tumors reveal subtypes of clinical and therapeutic relevance. iScience, 26(10), pp.108059–108059. doi:https://doi.org/10.1016/j.isci.2023.108059.
Jennison, C. and Turnbull, B.W. (2000). Group Sequential Methods with Applications to Clinical Trials. Chapman and Hall/CRC eBooks. Florida: Chapman and Hall doi:https://doi.org/10.1201/9780367805326.
Joensuu, H., Wardelmann, E., Sihto, H., Eriksson, M., Sundby Hall, K., Reichardt, A., Hartmann, J.T., Pink, D., Cameron, S., Hohenberger, P., Al-Batran, S.-E., Schlemmer, M., Bauer, S., Nilsson, B., Kallio, R., Junnila, J., Vehtari, A. and Reichardt, P. (2017). Effect of KIT and PDGFRA Mutations on Survival in Patients With Gastrointestinal Stromal Tumors Treated With Adjuvant Imatinib. JAMA Oncology, 3(5), p.602. doi:https://doi.org/10.1001/jamaoncol.2016.5751.
Jones, J., (2020) Tissue to background ratio. Available at: https://radiopaedia.org/articles/tissue-to-background-ratio (Accessed: 11th June 2025)
Kang, J., Demaria, S. and Formenti, S. (2016). Current clinical trials testing the combination of immunotherapy with radiotherapy. Journal for ImmunoTherapy of Cancer, 4(1). doi:https://doi.org/10.1186/s40425-016-0156-7.
Karapetis, C.S., Khambata-Ford, S., Jonker, D.J., O’Callaghan, C.J., Tu, D., Tebbutt, N.C., Simes, R.J., Chalchal, H., Shapiro, J.D., Robitaille, S., Price, T.J., Shepherd, L., Au, H.-J., Langer, C., Moore, M.J. and Zalcberg, J.R. (2008). K-ras mutations and benefit from cetuximab in advanced colorectal cancer. The New England journal of medicine, [online] 359(17), pp.1757–65. doi:https://doi.org/10.1056/NEJMoa0804385.
Kennedy, V.E. and Smith, C.C. (2020). FLT3 Mutations in Acute Myeloid Leukemia: Key Concepts and Emerging Controversies. Frontiers in Oncology, 10. doi:https://doi.org/10.3389/fonc.2020.612880.
Koo, M.M., Swann, R., McPhail, S., Abel, G.A., Elliss-Brookes, L., Rubin, G.P. and Lyratzopoulos, G. (2019). Presenting symptoms of cancer and stage at diagnosis: evidence from a cross-sectional, population-based study. The Lancet Oncology, [online] 21(1). doi:https://doi.org/10.1016/s1470-2045(19)30595-9.
Kumar, M., Ernani, V. and Owonikoko, T.K. (2015). Biomarkers and targeted systemic therapies in advanced non-small cell lung cancer. Molecular Aspects of Medicine, 45, pp.55–66. doi:https://doi.org/10.1016/j.mam.2015.06.009.
Lasota, J., Agnieszka Dansonka-Mieszkowska, Sobin, L.H. and Miettinen, M. (2004). A great majority of GISTs with PDGFRA mutations represent gastric tumors of low or no malignant potential. Laboratory Investigation, 84(7), pp.874–883. doi:https://doi.org/10.1038/labinvest.3700122.
Lien, E.C., Ghisolfi, L., Geck, R.C., Asara, J.M. and Toker, A. (2017). Oncogenic PI3K promotes methionine dependency in breast cancer cells through the cystine-glutamate antiporter xCT. Science Signalling 10(510): :eaao6604. doi:https://doi.org/10.1126/scisignal.aao6604.
Liu, X. and Locasale, J.W. (2017). Metabolomics: A Primer. Trends in Biochemical Sciences, 42(4), pp.274–284. doi:https://doi.org/10.1016/j.tibs.2017.01.004.
Llaverias, G., Danilo, C., Wang, Y., Witkiewicz, A.K., Daumer, K., Lisanti, M.P. and Frank, P.G. (2010). A Western-Type Diet Accelerates Tumor Progression in an Autochthonous Mouse Model of Prostate Cancer. The American Journal of Pathology, 177(6), pp.3180–3191. doi:https://doi.org/10.2353/ajpath.2010.100568.
Lopci, E. and Meignan, M. (2020). Current Evidence on PET Response Assessment to Immunotherapy in Lymphomas. PET Clinics, 15(1), pp.23–34. doi:https://doi.org/10.1016/j.cpet.2019.08.011.
Ludwig, J.A. and Weinstein, J.N. (2005). Biomarkers in Cancer Staging, Prognosis and Treatment Selection. Nature Reviews Cancer, 5(11), pp.845–856. doi:https://doi.org/10.1038/nrc1739.
Luengo, A., Gui, D.Y. and Vander Heiden, M.G. (2017). Targeting Metabolism for Cancer Therapy. Cell chemical biology, [online] 24(9), pp.1161–1180. doi:https://doi.org/10.1016/j.chembiol.2017.08.028.
M Gordian Adam, Beyer, G., Christiansen, N., Beate Kamlage, Pilarsky, C., Distler, M., Fahlbusch, T., Chromik, A., Klein, F., Bahra, M., Uhl, W., Grützmann, R., Mahajan, U.M., Weiss, F.U., Mayerle, J. and Lerch, M.M. (2021). Identification and validation of a multivariable prediction model based on blood plasma and serum metabolomics for the distinction of chronic pancreatitis subjects from non-pancreas disease control subjects. Gut, 70(11), pp.2150–2158. doi:https://doi.org/10.1136/gutjnl-2020-320723.
Martín, J., Poveda, A., Llombart-Bosch, A., Ramos, R., López-Guerrero, J.A., del Muro, J.G., Maurel, J., Calabuig, S., Gutierrez, A., de Sande, J.L.G., Martínez, J., De Juan, A., Laínez, N., Losa, F., Alija, V., Escudero, P., Casado, A., García, P., Blanco, R. and Buesa, J.M. (2005). Deletions Affecting Codons 557-558 of the c–KIT Gene Indicate a Poor Prognosis in Patients With Completely Resected Gastrointestinal Stromal Tumors: A Study by the Spanish Group for Sarcoma Research (GEIS). Journal of Clinical Oncology, 23(25), pp.6190–6198. doi:https://doi.org/10.1200/jco.2005.19.554.
Menendez, J.A. and Lupu, R. (2007). Fatty acid synthase and the lipogenic phenotype in cancer pathogenesis. Nature Reviews Cancer, 7(10), pp.763–777. doi:https://doi.org/10.1038/nrc2222.
Middleton, G., Robbins, H., Andre, F. and Swanton, C. (2022). A state-of-the-art review of stratified medicine in cancer: towards a future precision medicine strategy in cancer. Annals of Oncology, 33(2), pp.143–157. doi:https://doi.org/10.1016/j.annonc.2021.11.004.
My Cancer Genome (2017) STK11. Available at: https://www.mycancergenome.org/content/gene/STK11/ (Accessed: 4th June 2025)
National Cancer Institute (2025) Non-Small Cell Lung Cancer Treatment (PDQ®)–Patient Version. Available at: https://www.cancer.gov/types/lung/hp/non-small-cell-lung-treatment-pdq (Accessed: 30th May 2025)
National Health Service (n.d.) Acute Myeloid Leukaemia Available at: https://www.nhs.uk/conditions/acute-myeloid-leukaemia/ (Available at: 31st May 2025)
National Lung Screening Trial Research (2013) Results of Initial Low-Dose Computed Tomographic Screening for Lung Cancer. New England Journal of Medicine, 368(21), pp.1980–1991. doi:https://doi.org/10.1056/nejmoa1209120.
Nechita, V.I, Hajjar, N.A., Drugan, C., Cătană, C-S., Moiş, E., Nechita, M-A and Graur, F. (2023). Chitotriosidase and Neopterin as Two Novel Potential Biomarkers for Advanced Stage and Survival Prediction in Gastric Cancer—A Pilot Study. Diagnostics, 13(7), pp.1362–1362. doi:https://doi.org/10.3390/diagnostics13071362.
Nguyen, V.X., Nguyen, C.C., Nguyen, B.D. (2011) 18F-FDG PET/CT Imaging of the Pancreas: Spectrum of Diseases. Journal of the Pancreas, 12 (6), pp. 557-566.
Nishizuka, S., Chen, S.T., Gwadry, F.G., Alexander, J., Major, S.M., Scherf, U., Reinhold, W.C., Waltham, M., Charboneau, L., Young, L., Bussey, K.J., Kim, S., Lababidi, S., Lee, J.K., Pittaluga, S., Scudiero, D.A., Sausville, E.A., Munson, P.J., Petricoin, E.F. and Liotta, L.A. (2003). Diagnostic markers that distinguish colon and ovarian adenocarcinomas: identification by genomic, proteomic, and tissue array profiling. PubMed, 63(17), pp.5243–50.
Novruzov, E., Dendl, K., Ndlovu, H., Choyke, P.L., Dabir, M., Beu, M., Novruzov, F., Mehdi, E., Guliyev, F., Koerber, S.A., Lawal, I., Niegisch, G., Debus, J., Haberkorn, U., Sathekge, M. and Giesel, F.L. (2022). Head-to-head Intra-individual Comparison of [68Ga]-FAPI and [18F]-FDG PET/CT in Patients with Bladder Cancer. Molecular Imaging and Biology, 24(4), pp.651–658. doi:https://doi.org/10.1007/s11307-022-01715-3.
O’Brien, P.C. and Fleming, T.R. (1979). A Multiple Testing Procedure for Clinical Trials. Biometrics, 35(3), pp.549–556. doi:https://doi.org/10.2307/2530245.
Pang, Y., Zhao, L., Luo, Z., Hao, B., Wu, H., Lin, Q., Sun, L. and Chen, H. (2021). Comparison of 68Ga-FAPI and 18F-FDG Uptake in Gastric, Duodenal, and Colorectal Cancers. Radiology, 298(2), pp.393–402. doi:https://doi.org/10.1148/radiol.2020203275.
Perez-Diez, A., Morgun, A. and Shulzhenko, N. (2013) Microarrays for Cancer Diagnosis and Classification. Available at: https://www.ncbi.nlm.nih.gov/books/NBK6624/ (Accessed: 10th June 2025)
Phillips, M., Gleeson, K., Hughes, J.M.B., Greenberg, J., Cataneo, R.N., Baker, L. and McVay, W.P. (1999). Volatile organic compounds in breath as markers of lung cancer: a cross-sectional study. The Lancet, 353(9168), pp.1930–1933. doi:https://doi.org/10.1016/s0140-6736(98)07552-7.
Piantadosi, S. (1997) Clinical Trials: A Methodologic Perspective. New York: Wiley.
Pichler, R., Fritz, J., Heidegger, I., Steiner, E., Zoran Culig, Klocker, H. and Fuchs, D. (2017). Predictive and prognostic role of serum neopterin and tryptophan breakdown in prostate cancer. Cancer Science, 108(4), pp.663–670. doi:https://doi.org/10.1111/cas.13171.
Playdon, M.C., Ziegler, R.G., Sampson, J.N., Stolzenberg-Solomon, R., Thompson, H.J., Irwin, M.L., Mayne, S.T., Hoover, R.N. and Moore, S.C. (2017). Nutritional metabolomics and breast cancer risk in a prospective study. The American Journal of Clinical Nutrition, 106(2), pp.637–649. doi:https://doi.org/10.3945/ajcn.116.150912.
Pocket Health (2025) How to read a PET Scan Report Available at: https://www.pockethealth.com/patient-resources/how-read-a-pet-scan-report/ (Accessed: 10th June 2025)
Rafii, F., Badr and M’hamed Aït Kbir (2017). New Approach for Microarray Data Decision Making with Respect to Multiple Sources. pp.1–5. doi:https://doi.org/10.1145/3090354.3090463.
Ramaswamy, S., Ross, K.N., Lander, E.S. and Golub, T.R. (2002). A molecular signature of metastasis in primary solid tumors. Nature Genetics, 33(1), pp.49–54. doi:https://doi.org/10.1038/ng1060.
Reddy, B.S., Mastromarino, A. and Wynder, E.L. (1975). Further leads on metabolic epidemiology of large bowel cancer. Cancer Research, 35(11 Pt. 2), pp.3403–6.
Reid, M.A., Dai, Z. and Locasale, J.W. (2017). The impact of cellular metabolism on chromatin dynamics and epigenetics. Nature Cell Biology, 19(11), pp.1298–1306. doi:https://doi.org/10.1038/ncb3629.
Rhodes, D.R. and Chinnaiyan, A.M. (2005). Integrative analysis of the cancer transcriptome. Nature Genetics, 37(S6), pp.S31–S37. doi:https://doi.org/10.1038/ng1570.
Roepman, P., Wessels, A., Nienke Kettelarij, Kemmeren, P., Miles, A.J., Lijnzaad, P., Marcel G.J. Tilanus, Koole, R., Hordijk, G.J., Peter, Marcel, Slootweg, P.J. and Frank (2005). An expression profile for diagnosis of lymph node metastases from primary head and neck squamous cell carcinomas. Nature Genetics, 37(2), pp.182–186. doi:https://doi.org/10.1038/ng1502.
Saâda-Bouzid, E., Defaucheux, C., Karabajakian, A., Coloma, V.P., Servois, V., Paoletti, X., Even, C., Fayette, J., Guigay, J., Loirat, D., Peyrade, F., Alt, M., Gal, J. and Le Tourneau, C. (2017). Hyperprogression during anti-PD-1/PD-L1 therapy in patients with recurrent and/or metastatic head and neck squamous cell carcinoma. Annals of Oncology, [online] 28(7), pp.1605–1611. doi:https://doi.org/10.1093/annonc/mdx178.
Salama, A.K.S., Li, S., Macrae, E.R., Park, J.-I., Mitchell, E.P., Zwiebel, J.A., Chen, H.X., Gray, R.J., McShane, L.M., Rubinstein, L.V., Patton, D., Williams, P.M., Hamilton, S.R., Armstrong, D.K., Conley, B.A., Arteaga, C.L., Harris, L.N., O’Dwyer, P.J., Chen, A.P. and Flaherty, K.T. (2020). Dabrafenib and Trametinib in Patients With Tumors With BRAFV600E Mutations: Results of the NCI-MATCH Trial Subprotocol H. Journal of Clinical Oncology, 38(33), pp.3895–3904. doi:https://doi.org/10.1200/jco.20.00762.
Sandler, M.P. (2020) Diagnostic Nuclear Medicine. Philadelphia: Lippincott Williams & Wilkins
Sano, H., Kane, S., Sano, E., Mı̂ineaC.P., Asara, J.M., Lane, W.S., Garner, C.W. and Lienhard, G.E. (2003). Insulin-stimulated Phosphorylation of a Rab GTPase-activating Protein Regulates GLUT4 Translocation. Journal of Biological Chemistry, 278(17), pp.14599–14602. doi:https://doi.org/10.1074/jbc.c300063200.
Saqib, P., Qamar, U., Reda Ayesha Khan and Aslam, A. (2020). MF-GARF: Hybridizing Multiple Filters and GA Wrapper for Feature Selection of Microarray Cancer Datasets. doi:https://doi.org/10.23919/icact48636.2020.9061234.
Schmidt, D.R., Patel, R., Kirsch, D.G., Lewis, C.A., Vander Heiden, M.G. and Locasale, J.W. (2021). Metabolomics in cancer research and emerging applications in clinical oncology. CA: A Cancer Journal for Clinicians, 71(4). doi:https://doi.org/10.3322/caac.21670.
Segal, E., Friedman, N., Kaminski, N., Regev, A. and Koller, D. (2005). From signatures to models: understanding cancer using microarrays. Nature Genetics, 37(S6), pp.S38–S45. doi:https://doi.org/10.1038/ng1561.
Selvaraj, S. and Natarajan, J. (2011). Microarray Data Analysis and Mining Tools. Bioinformation, 6(3), pp.95–99. doi:https://doi.org/10.6026/97320630006095.
Shah, S., Carriveau, W.J., Li, J., Campbell, S.L., Piotr Kopiński, Lim, H., Daurio, N.A., Trefely, S., Kyoung Jae Won, Wallace, D.C., Constantinos Koumenis, Mancuso, A.A. and Wellen, K.E. (2016). Targeting ACLY sensitizes castration-resistant prostate cancer cells to AR antagonism by impinging on an ACLY-AMPK-AR feedback mechanism. Oncotarget, 7(28), pp.43713–43730. doi:https://doi.org/10.18632/oncotarget.9666.
Shameem Fawdar, Trotter, E.W., Li, Y., Stephenson, N.L., Hanke, F., Marusiak, A.A., Edwards, Z.C., Ientile, S., Bohdan Waszkowycz, Miller, C. and Brognard, J. (2013). Targeted genetic dependency screen facilitates identification of actionable mutations in FGFR4, MAP3K9, and PAK5 in lung cancer. Proceedings of the National Academy of Sciences of the United States of America, 110(30), pp.12426–12431. doi:https://doi.org/10.1073/pnas.1305207110.
Singh, S. (2016). Stratified Medicine: Maximizing Clinical Benefit by Biomarker-Driven Health Care. Nestle Nutrition Institute Workshop Series, [online] 84, pp.91–102. doi:https://doi.org/10.1159/000436992.
Skusa, C., Weber, M.-A., Böttcher, S. and Thierfelder, K.M. (2020). Criteria-Based Imaging and Response Evaluation of Lymphoma 20 Years After Cheson: What is New? RöFo – Fortschritte auf dem Gebiet der Röntgenstrahlen und der bildgebenden Verfahren, 192(07), pp.657–668. doi:https://doi.org/10.1055/a-1091-8897.
Som, P., Atkins, H.L., Bandoypadhyay, D., Fowler, J.S., MacGregor, R.R., Matsui, K., Oster, Z.H., Sacker, D.F., Shiue, C.Y., Turner, H., Wan, C.-N. ., Wolf, A.P. and Zabinski, S.V. (1980). A FLUORINATED GLUCOSE ANALOG, 2-FLUORO-2-DEOXY-D-GLUCOSE (F-18). Journal of Computer Assisted Tomography, 4(6), p.878. doi:https://doi.org/10.1097/00004728-198012000-00045.
Song, M.S., Salmena, L. and Pandolfi, P.P. (2012). The functions and regulation of the PTEN tumour suppressor. Nature Reviews Molecular Cell Biology, 13(5), pp.283–296.
Svensson, R.U., Parker, S.J., Eichner, L.J., Kolar, M.J., Wallace, M., Brun, S.N., Lombardo, P.S., Van Nostrand, J.L., Hutchins, A., Vera, L., Gerken, L., Greenwood, J., Bhat, S., Harriman, G., Westlin, W.F., Harwood, H.J., Saghatelian, A., Kapeller, R., Metallo, C.M. and Shaw, R.J. (2016). Inhibition of acetyl-CoA carboxylase suppresses fatty acid synthesis and tumor growth of non-small-cell lung cancer in preclinical models. Nature Medicine, [online] 22(10), pp.1108–1119. doi:https://doi.org/10.1038/nm.4181.
Tang, W., Putluri, V., Ambati, C.R., Dorsey, T.H., Putluri, N. and Ambs, S. (2019). Liver- and Microbiome-derived Bile Acids Accumulate in Human Breast Tumors and Inhibit Growth and Improve Patient Survival. Clinical Cancer Research, 25(19), pp.5972–5983. doi:https://doi.org/10.1158/1078-0432.ccr-19-0094.
Tanizaki, J., Hayashi, H., Kimura, M., Tanaka, K., Takeda, M., Shimizu, S., Ito, A. and Nakagawa, K. (2016). Report of two cases of pseudoprogression in patients with non–small cell lung cancer treated with nivolumab—including histological analysis of one case after tumor regression. Lung Cancer, 102, pp.44–48. doi:https://doi.org/10.1016/j.lungcan.2016.10.014.
Trusheim, M.R., Berndt, E.R. and Douglas, F.L. (2007). Stratified medicine: strategic and economic implications of combining drugs and clinical biomarkers. Nature Reviews Drug Discovery, [online] 6(4), pp.287–293. doi:https://doi.org/10.1038/nrd2251.
Tsao, A.S., Tang, X.M., Sabloff, B., Xiao, L., Shigematsu, H., Roth, J., Spitz, M., Hong, W.K., Gazdar, A. and Wistuba, I. (2006). Clinicopathologic Characteristics of the EGFR Gene Mutation in Non–small Cell Lung Cancer. Journal of Thoracic Oncology, 1(3), pp.231–239. doi:https://doi.org/10.1016/s1556-0864(15)31573-2.
Van den Bergh, AC., Pruim, J., Links, T.P., Anton, Sluiter, W., Wolffenbuttel, B.H.R., Langendijk, J.A., Hoving, E.W. and Dullaart, R.P.F. (2011). Tyrosine positron emission tomography and protein synthesis rate in pituitary adenoma: Different effects of surgery and radiation therapy. Radiotherapy and Oncology, 98(2), pp.213–216. doi:https://doi.org/10.1016/j.radonc.2010.12.020.
Vernieri, C., Casola, S., Foiani, M., Pietrantonio, F., de Braud, F. and Longo, V. (2016). Targeting cancer metabolism: dietary and pharmacological interventions. Cancer discovery, [online] 6(12), pp.1315–1333. doi:https://doi.org/10.1158/2159-8290.CD-16-0615.
Virtanen, C. and Woodgett, J. (2008). Clinical Uses of Microarrays in Cancer Research. Methods in Molecular MedicineTM, pp.87–113. doi:https://doi.org/10.1007/978-1-60327-148-6_6.
Wang, L., Tang, G., Hu, K., Liu, X., Zhou, W., Li, H., Huang, S., Han, Y., Chen, L., Zhong, J. and Wu, H. (2022). Comparison of 68Ga-FAPI and 18F-FDG PET/CT in the Evaluation of Advanced Lung Cancer. Radiology, 303(1), pp.191–199. doi:https://doi.org/10.1148/radiol.211424.
Warburg, O. (1924). über den Stoffwechsel der Carcinomzelle. Biochem Zeitschrift, 152, p. 309-44. doi:https://doi.org/10.1007/bf01726151.
Warburg, O. (1956). On the Origin of Cancer Cells. Science, 123(3191), pp.309–314. doi:https://doi.org/10.1126/science.123.3191.309.
Welsh, J.B., Sapinoso, L.M., Su, A.I., Kern, S.G., J Wang-Rodriguez, Moskaluk, C.A., Frierson, H.F. and Hampton, G.M. (2001). Analysis of gene expression identifies candidate markers and pharmacological targets in prostate cancer. PubMed, 61(16), pp.5974–8.
Wishart, D.S., Jewison, T., Guo, A.C., Wilson, M., Knox, C., Liu, Y., Djoumbou, Y., Mandal, R., Aziat, F., Dong, E., Bouatra, S., Sinelnikov, I., Arndt, D., Xia, J., Liu, P., Yallou, F., Bjorndahl, T., Perez-Pineiro, R., Eisner, R. and Allen, F. (2012). HMDB 3.0—The Human Metabolome Database in 2013. Nucleic Acids Research, 41(D1), pp.D801–D807. doi:https://doi.org/10.1093/nar/gks1065.
Zelba, H., Shao, B., Rabsteyn, A., Reinhardt, A., Greve, C., Oenning, L., Kayser, S., Kyzirakos, C., Latzer, P., Riedlinger, T., Bartsch, O., Wünsche, J., Harter, J., Feldhahn, M., Bantel, Y., Johänning, J., Ködding, J., Hadaschik, D., Schulze, M. and Battke, F. (2025). In-depth characterization of vaccine-induced neoantigen-specific T cells in patients with IDH1-mutant glioma undergoing personalized peptide vaccination. Journal for ImmunoTherapy of Cancer, 13(6), p.e011070. doi:https://doi.org/10.1136/jitc-2024-011070.
Zhou, W., Capello, M., Fredolini, C., Racanicchi, L., Piemonti, L., Liotta, L.A., Novelli, F. and Petricoin, E.F. (2011). Proteomic Analysis Reveals Warburg Effect and Anomalous Metabolism of Glutamine in Pancreatic Cancer Cells. Journal of Proteome Research, 11(2), pp.554–563. doi:https://doi.org/10.1021/pr2009274.

Leave a comment